business segments
performance in 2014
Scroll down for more content
Exploration & Production
Resources discovered in the year
900
mmboe
Exploration acreage acquired
100,000
sqkm
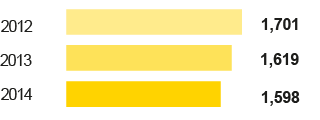
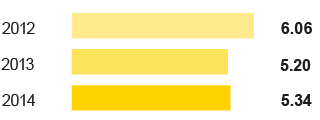
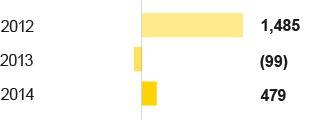
Adjusted operating profit (€ million)
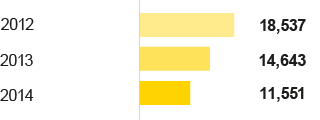

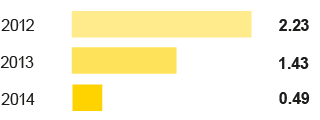
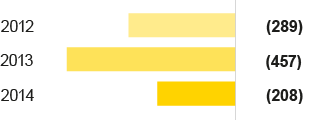
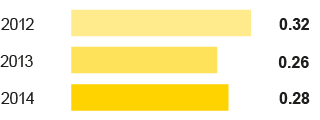
Oil spills due to operations (bbl;>1 bbl)
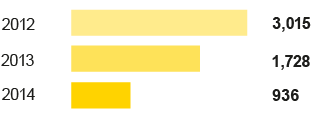

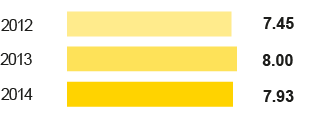
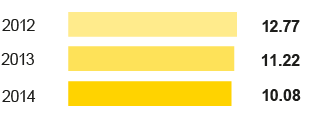
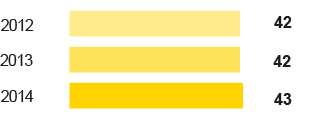
Emissions from flaring (mmtonnes CO2eq)

Record level of produced water re-injected
56%
Reserves replacement ratio, all sources
112%
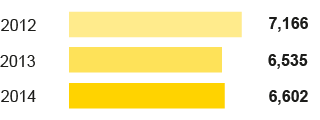
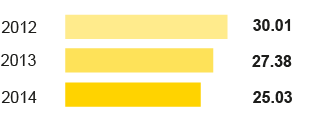
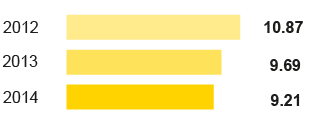
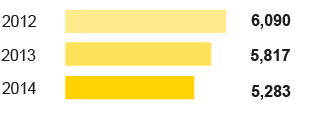
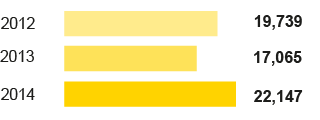
Hydrocarbons production (kboe/d)

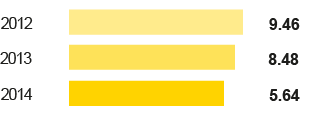
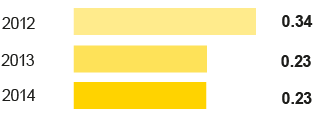
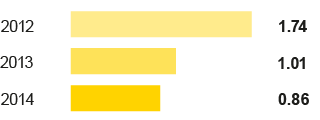
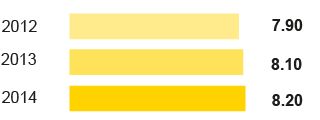
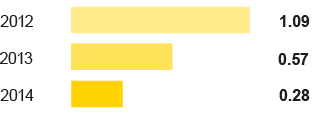
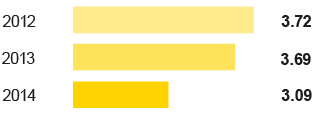
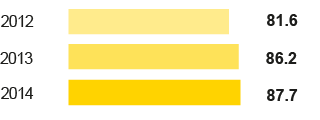
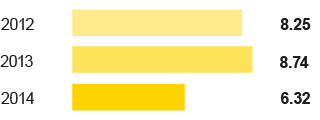
Injury frequency rate(No. of accidents per million of worked hours)

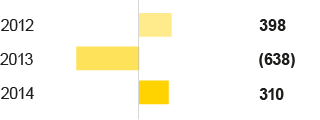
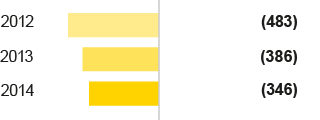
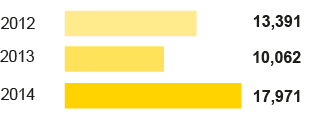
Proved hydrocarbons reserves(mmboe)

Capital expenditures
€10.5
billion
in reserves exploration and development
Production in the year
+0.6%
excluding the impact of assets in Siberia
Gas & Power
Long-term gas supply
approx.
70%
portfolio hub indexed
Cash benefits
€0.66
billion
from contract renegotiations
Adjusted operating profit
(€ million)

Injury frequency rate
(No. of accidents per million of worked hours)

Worldwide gas sales
(bcm)
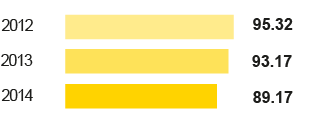

Customer satisfaction score
93.4%
Electricity sold
33.58
TWh
Customers in Italy
(million)

LNG sales
(bcm)

Direct GHG emissions
(mmtonnes CO2eq)

Customers
approx.
10
million
including households, professionals, small and medium sized enterprises, and public bodies in Italy and the rest of Europe
Development and growth in the segments
value added
Refining & Marketing
Refining capacity
-30%
vs 2012
due to reconversion in biofuel plants
Production capacity
0.3
milion tonnes/year
of Venice Green Refinery
Adjusted operating profit
(€ million)

Injury frequency rate
(No. of accidents per million of worked hours)

Refinery throughputs on own account
(mmtonnes)

Biofuels marketed
+2.09
milion tonnes
Refinery utilization rate
78%
with a $6/barrel breakeven margin
Direct GHG emissions
(mmtonnes CO2eq)

Retail sales of petroleum products in Europe
(mmtonnes)

Customer satisfaction index
(likert scale)

Agreement for the conversion of
Gela Refinery
in bio-refinery
Standard Eni Refining Margin
+32.1%
vs 2013
not withstanding industry structural headwinds
Versalis
Average plant utilization rate
71.3%
due to business restructuring
Research & Development expenses
€40
million
Adjusted operating profit
(€ million)

Injury frequency rate
(No. of accidents per million of worked hours)

Production
(ktonnes)

Green Chemical plant
start-up
in Sardinia through the reconversion of Porto Torres site
Divestment of
Sarroch
plant
in line with turnaround strategy
Direct GHG emissions
(mmtonnes CO2eq)

Sales of petrochemical products
(ktonnes)

Recycled / reused water
(%)

New strategic
partnerships
in the Far East
New patent applications filed
14
Engineering & Construction
Adjusted operating profit
+€578
million
Order backlog
+€5,082
million
Adjusted operating profit
(€ million)

Order backlog
(€ million)

Orders acquired
(€ million)

Orders acquired
+€7,909
million
Injury frequency rate
+7.7%
Injury frequency rate
(No. of accidents per million of worked hours)

Local managers
(%)

Water withdrawal
(million cubic meters)

New patent applications filed
20
Water withdrawal
-27.7%