Refining & Marketing
Break-even refining margin
about
5$/blAdjusted operating profit
Positive
adjusted operating profit anticipating strategic plan
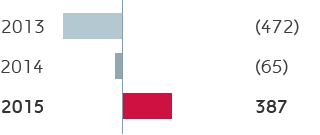
Adjusted operating profit (€ million)

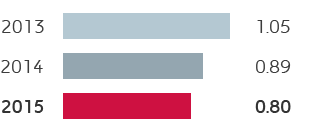
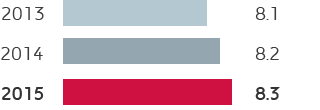
Injury frequency rate (No. of accidents per million of worked hours)

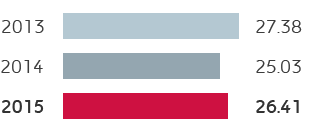
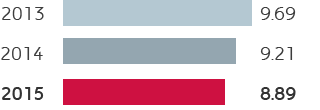
Refinery throughputs on own account (mmtonnes)

Green productions
+53.8%
Market share in Italy
24.5%
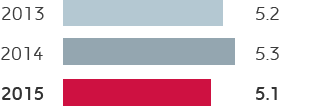
Direct GHG emissions (mmtonnes CO2eq)

Retail sales of refined products in Europe (mmtonnes)

Customer satisfaction index (likert scale)

Refinery utilization rate
+16.3%
vs 2014
Valorization of
EST technology
through licensing agreement