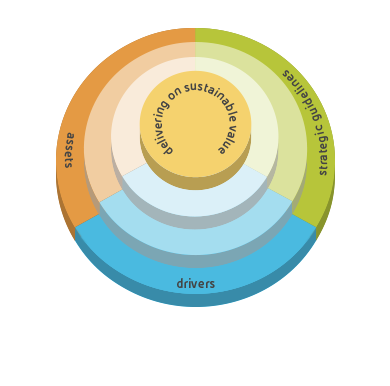
Eni’s business model
Eni’s business model targets long-term value creation by delivering on profitability and growth, improving efficiency and mitigating risks, taking into account the interests of all the stakeholders.
The main capitals used by Eni (financial capital, manufacture capital, intellectual capital, natural capital, human capital, social and relationship capital) are classified in accordance with the criteria included in the “International IR Framework” published by the International Integrated Reporting Council (IIRC). Our 2013 robust financial results and sustainability performance rely on the responsible and efficient use of our capitals which resulted in operational excellence, asset integrity, handling of operational risk, preservation of health, safety and the environment.
integrated risk management
Integrated risk management model across our businesses
governance
Framework of stringent and clear rules of governance
strategic guidelines
What are the strategic guidelines to use and develop our assets?
- profitable growth
- strict capex discipline
- focus on core areas
- partnerships with NOCs
- reduction of time to market
- operatorship
- gas supply contracts renegotiation
- leadership in the european gas market
- capacity reduction in commodity businesses
- leveraging on asset flexibility
- focus on customers and premium⁄niche segments
assets
What distintive assets for delivering Sustainable Value?
- solid resource base
- giant projects
- high potential exploration portfolio
- low cost position
- diversifed gas supply portfolio
- large and international customer base
- plant effciency
- eni brand
drivers
What principles for delivering Sustainable Value?
- cooperation for host countries’ development
- integration all along the energy supply chain
- excellence in conducting our operations
- innovation in developing competitive solutions
- inclusiveness of eni’s people and diversity promotion
- responsibility in managing the business
financial capital | |
stock of capital
value creation for Eni
|
Eni’s main actions
value creation for Eni’s stakeholders
|
manufacture capital | |
stock of capital
value creation for Eni
|
Eni’s main actions
value creation for Eni’s stakeholders
|
intellectual capital | |
stock of capital
value creation for Eni
|
Eni’s main actions
value creation for Eni’s stakeholders
|
human capital | |
stock of capital
value creation for Eni
|
Eni’s main actions
value creation for Eni’s stakeholders
|
social and relationship capital | |
stock of capital
value creation for Eni
|
Eni’s main actions
value creation for Eni’s stakeholders
|
natural capital | |
stock of capital
value creation for Eni
|
Eni’s main actions
value creation for Eni’s stakeholders
|
These results are based on the great attention paid to the specific features of the Countries where Eni operates and thus on cooperation for their development. Starting from an assessment of their potential Eni promotes partnerships providing local people new opportunities for growth and development. This is a competitive lever in the Countries where Eni’s experience is more recent but also in more established areas. In each one of them, our objective is to create high quality jobs targeted at local resources on an equal opportunity basis.
The culture of plurality is a distinctive feature of Eni’s strongly internationally oriented business model.
The inclusion of all Eni’s people with their diversity merges with the protection of health and safety on the workplace, with the professional development and engagement in the company’s objectives. Eni guarantees equal treatment to all its people defining worldwide remuneration policies and committing itself and its suppliers to the respect of the basic workers’ rights in all the Countries of operation.
Responsibility is assumed as commitment to transparency and anticorruption practices while respecting human rights in all areas and promoting the development of Countries and their society. In deploying its activities, Eni activates a flow of resources that can be crucial for economic growth. Only a strict discipline of integrity and promotion of transparency, in particular as concerns payments to producing Countries can protect from corruption and build the basis for a proper use of these resources aimed at sustainable development.
Our way of doing business is based on operating excellence that leverages on best practices, quality systems, advanced and high quality technologies to guarantee full respect of communities and their environment. A safe management of plants and the mitigation of risks represent a prerequisite for a proper environmental management and for the reduction of environmental impacts.
The exploration of frontier areas and Asian territories that are considered difficult and environmentally sensitive are the result not only of Eni’s drive to development while applying new technologies but also of a responsible and sustainable corporate strategy.
Eni’s presence worldwide in the most sensitive areas was made possible by technological innovation and the application of advanced methodologies that allow work also in harsh contexts guaranteeing the protection of the environments and the conservation of sensitive ecosystems and biodiversity.
Lastly, as an integrated energy company, Eni works alongside governments of producing Countries in planning and designing solutions for the development of local energy systems, cooperating with national companies in the development of energy sources and building infrastructure for their use and monetization. One of the main actions performed concerns the fight against energy poverty in particular in Sub-Saharan Africa with the support of the development of local technologies and the reduction of waste where infrastructure already exists.
Eni has in fact started a new path of evolution and relaunch of its chemical and refining activities directing its focus on the so called green chemistry and bio-refining.
The table below describes the main results associated to each capital. For detailed information and results from the use of financial and manufacture capitals, see the Consolidated Sustainability Statements and the Financial Review of the 2013 Annual Report.
human capital
human capital
|
Safety |
|
2009 |
2010 |
2011 |
2012 |
2013 |
|
|
|
|
|
|
|
|
|
Injury frequency rate |
(number of accidents per million of worked hours) |
0.92 |
0.75 |
0.60 |
0.49 |
0.35 |
|
- employees |
|
0.84 |
0.80 |
0.65 |
0.57 |
0.40 |
|
- contractors |
|
0.97 |
0.71 |
0.57 |
0.45 |
0.32 |
|
Fatality index |
(fatal injuries/one hundred millions of worked hours) |
1.20 |
4.77 |
1.94 |
1.10 |
0.98 |
|
- employees |
|
0.89 |
6.66 |
1.19 |
0.87 |
1.74 |
|
- contractors |
|
1.40 |
3.55 |
2.38 |
1.23 |
0.53 |
|
Safety expenditure and investments |
(€ million) |
488 |
260 |
320 |
371 |
409 |
|
Professional illnesses reported |
(number) |
123 |
184 |
135 |
69 |
68 |
|
Health and hygiene expenditure and investments |
(€ million) |
78 |
55 |
79 |
48 |
51 |
|
Employees |
|
2009 |
2010 |
2011 |
2012 |
2013 |
|
|
|
|
|
|
|
|
|
Employees as of December 31 |
(number) |
71,461 |
73,768 |
72,574 |
77,838 |
82,289 |
|
- men |
|
59,506 |
61,607 |
60,032 |
64,978 |
68,688 |
|
- women |
|
11,955 |
12,161 |
12,542 |
12,860 |
13,601 |
|
Employees abroad by type |
|
42,633 |
45,967 |
45,516 |
51,034 |
55,507 |
|
- locals |
|
33,483 |
35,835 |
34,801 |
39,668 |
43,121 |
|
- Italian expatriates |
|
2,771 |
3,123 |
3,208 |
3,867 |
3,955 |
|
- International expatriates (including TCN) |
|
6,379 |
7,009 |
7,507 |
7,499 |
8,431 |
|
Senior Managers employed |
|
1,437 |
1,454 |
1,468 |
1,474 |
1,475 |
|
- of which women |
|
141 |
147 |
152 |
159 |
160 |
|
Managers/Supervisors employed |
|
12,395 |
12,837 |
12,754 |
13,199 |
13,637 |
|
- of which women |
|
2,258 |
2,421 |
2,477 |
2,615 |
2,767 |
|
Employees |
|
33,931 |
34,599 |
36,019 |
38,497 |
39,943 |
|
- of which women |
|
9,171 |
9,040 |
9,394 |
9,777 |
10,310 |
|
Workers employed |
|
23,698 |
24,878 |
22,333 |
24,668 |
27,234 |
|
- of which women |
|
385 |
553 |
519 |
309 |
364 |
|
Local employees abroad by professional category |
|
33,483 |
35,835 |
34,801 |
39,668 |
43,121 |
|
- of which senior managers |
|
224 |
228 |
228 |
223 |
216 |
|
- of which managers/supervisors |
|
3,138 |
3,461 |
3,476 |
3,798 |
4,001 |
|
- of which employees |
|
15,533 |
16,269 |
17,529 |
19,683 |
20,522 |
|
- of which workers |
|
14,588 |
15,877 |
13,568 |
15,964 |
18,382 |
|
Training hours |
(thousand hours) |
2,930 |
2,949 |
3,127 |
3,132 |
4,350 |
social and relationship capital
social and relationship capital
|
Spending for the territory |
(€ million) |
2009 |
2010 |
2011 |
2012 |
2013 |
|
|
|
|
|
|
|
|
|
Total spending for the territory |
|
98 |
107 |
101 |
91 |
101 |
|
- of which interventions on the territories from agreements, conventions and PSA |
|
70 |
75 |
69 |
63 |
58 |
|
- of which short-term investments linked to initiatives in favour of the territories |
|
1 |
4 |
1 |
3 |
1 |
|
- of which association memberships fees |
|
1 |
2 |
2 |
2 |
2 |
|
- of which contributions to the Eni Foundation |
|
5 |
5 |
3 |
- |
10 |
|
- of which sponsorships for the territory |
|
16 |
17 |
22 |
19 |
26 |
|
- of which contributions to the Eni Enrico Mattei Foundation |
|
4 |
4 |
4 |
4 |
4 |
|
Procurement by geographical area 2013 |
Africa |
Americas |
Asia |
Italy |
Rest of Europe |
Oceania |
|
|
|
|
|
|
|
|
|
|
|
Number of suppliers |
(number) |
7,105 |
6,116 |
5,246 |
9,980 |
9,940 |
520 |
|
Total procurement |
(€ million) |
8,434 |
2,871 |
5,036 |
10,714 |
5,340 |
419 |
|
- in goods |
(%) |
17.5 |
24.2 |
16.2 |
11.2 |
17.9 |
10.3 |
|
- in works |
|
16.3 |
26.3 |
21.5 |
12.4 |
26.1 |
1.0 |
|
- in services |
|
60.8 |
47.8 |
49.2 |
73.1 |
53.7 |
88.2 |
|
- of which unidentifiable |
|
5.4 |
1.7 |
13.1 |
3.3 |
2.3 |
0.5 |
|
Local procurement 2013 by Country |
|
|
|
|
|
% procurement on local market |
Countries |
|
|
|
|
0 - 25 % |
UAE, Luxembourg, Malaysia, Mozambique, Peru, Portugal. |
|
26 -49 % |
Angola, China, Germany, Iran, Iraq, Libya, Norway, Republic Czech, Slovenia. |
|
50 - 74 % |
Algeria, Saudi Arabia, Brazil, Republic of Congo, Croatia, Egypt, France, Ghana, United Kingdom, India, Italy, Kazakhstan, the Netherlands, Pakistan, Singapore, Switzerland, Togo, Tunisia, Hungary. |
|
75 - 100 % |
Argentina, Australia, Austria, Belgium, Canada, Cyprus, Ecuador, Gabon, Indonesia, Kenya, Mexico, Nigeria, Poland, Romania, Russia, Spain, United States, Ukraine, Venezuela, Vietnam. |
|
Relations with suppliers |
|
2009 |
2010 |
2011 |
2012 |
2013 |
|
|
|
|
|
|
|
|
|
Procurement by macro-class |
(€ million) |
33,084 |
31,187 |
32,586 |
31,811 |
32,814 |
|
Supplier concentration top 20 |
(%) |
24 |
18 |
20 |
15 |
17 |
|
Suppliers |
(number) |
33,447 |
32,601 |
31,878 |
32,621 |
34,848 |
|
Qualification cycles carried out during the year |
|
21,066 |
32,962 |
26,936 |
31,991 |
46,913 |
|
Suppliers subjected to qualification procedures including screening on human rights |
|
7,798 |
10,096 |
11,471 |
12,471 |
14,833 |
|
% procurement from suppliers subjected to qualification procedures including screening on human rights |
(%) |
87 |
85 |
90 |
88 |
87 |
|
Relations with customers |
|
2009 |
2010 |
2011 |
2012 |
2013 |
||||
|
||||||||||
|
|
|
|
|
|
|
|
||||
|
R&M Customer satisfaction |
|
|
|
|
|
|
||||
|
Customer satisfaction index |
(likert scale) |
7.93 |
7.84 |
7.74 |
7.90 |
8.10 |
||||
|
Customers involved in the satisfaction survey (R&M) |
(number) |
10,711 |
30,618 |
30,524 |
30,438 |
29,863 |
||||
|
|
|
|
|
|
|
|
||||
|
G&P Customer satisfaction |
|
|
|
|
|
|
||||
|
Eni customer satisfaction score |
(%) |
83.7 |
87.4 |
88.6 |
89.7 |
90.4 (b) |
||||
|
Panel Average (G&P) (a) |
|
87.0 |
87.4 |
88.9 |
91.2 |
93.1 |
||||
natural capital
natural capital
|
Environmental performance |
2009 |
2010 |
2011 |
2012 |
2013 |
|||||
|
||||||||||
|
|
|
|
|
|
|
|
||||
|
Direct GHG emissions |
(tons CO2eq) |
55,494,551 |
58,259,157 |
49,128,806 |
52,498,789 |
47,299,030 |
||||
|
- of which CO2 from combustion and process |
(tons) |
35,788,121 |
37,948,625 |
35,319,845 |
36,365,220 |
34.171.33 |
||||
|
- of which CO2 equivalents from flaring |
(tons CO2eq) |
13,839,353 |
13,834,988 |
9,553,894 |
9,461,518 |
8,478,376 |
||||
|
- of which CO2 equivalents from CH4 (methane) |
|
3,684,874 |
4,135,523 |
3,222,051 |
4,475,756 |
2,901,503 |
||||
|
- of which CO2 equivalents from venting |
|
2,182,202 |
2,340,021 |
1,033,017 |
2,196,295 |
1,747,812 |
||||
|
CO2eq emissions/ 100% net operated hydrocarbon production |
(tons CO2eq/ toe) |
0.235 |
0.235 |
0.206 |
0.226 |
0.222 |
||||
|
CO2eq emissions/ kWheq (EniPower) |
(kg CO2eq/ kWheq) |
0.410 |
0.407 |
0.404 |
0.399 |
0.407 |
||||
|
CO2eq emissions/ uEDC (R&M) |
(tons CO2eq/ kbbl/SD) |
1,240 |
1,284 |
1,231 |
1,143 |
1,049 |
||||
|
NOx (nitrogen oxide) emissions |
(tons NO2eq) |
110,910 |
106,040 |
97,114 |
115,571 |
102,295 |
||||
|
SOx (sulphur oxide) emissions |
(tons SO2eq) |
45,985 |
50,085 |
37,943 |
30,137 |
27,949 |
||||
|
NMVOC (Non-Methane Volatile Organic Compounds) emissions |
(tons) |
75,318 |
68,490 |
46,228 |
48,702 |
43,536 |
||||
|
TSP (Total Suspended Particulate) emissions |
|
3,936 |
3,783 |
3,297 |
3,548 |
2,848 |
||||
|
Energy consumption from production activities/100% operated hydrocarbon gross production (E&P) |
(GJ/toe) |
|
|
1,615 |
1,557 |
1,536 |
||||
|
Total water withdrawals |
(mmcm) |
2,839.97 |
2,786.78 |
2,577.98 |
2,359.21 |
2,206.36 |
||||
|
Total production and/or process water extracted (a) |
|
59.67 |
61.15 |
58.16 |
61.17 |
61.32 |
||||
|
- of which re-injected |
|
23.32 |
27.11 |
25.18 |
20.82 |
20.23 |
||||
|
Total recycled and/or reused water |
|
490.22 |
544.63 |
519.43 |
519.93 |
735.89 |
||||
|
Total number of oil spills (>1 barile) (b) |
(number) |
308 |
330 |
418 |
329 |
386 |
||||
|
Total volume of oil spills (>1 barile) (b) |
(barrels) |
21,547 |
22,964 |
14,952 |
12,428 |
7,903 |
||||
|
- of which from sabotage and terrorism |
|
15,288 |
18,695 |
7,657 |
8,669 |
6,002 |
||||
|
- of which due to operations |
|
6,259 |
4,269 |
7,295 |
3,759 |
1,901 |
||||
|
Waste from production activities |
(tons) |
1,078,839 |
1,400,488 |
1,309,135 |
1,378,385 |
1,599,931 |
||||
|
Hazardous waste from production activities |
|
418,120 |
489,108 |
476,552 |
365,695 |
374,412 |
||||
|
Non hazardous waste from production activities |
|
660,719 |
911,380 |
832,582 |
1,012,690 |
1,225,519 |
||||
|
Environmental expenditure and investments |
(€ million) |
1,231 |
916 |
893 |
743 |
711 |
||||
intellectual capital
intellectual capital
|
Technological innovation |
|
2009 |
2010 |
2011 |
2012 |
2013 |
|
|
|
|
|
|
|
|
|
R&D expenditure |
(€ million) |
287 |
275 |
246 |
263 |
218 |
|
- R&D expenditure net of general and administrative costs |
|
233 |
218 |
190 |
211 |
197 |
|
Personnel employed in R&D activities (full time equivalent) |
(number) |
1,019 |
1,019 |
925 |
975 |
986 |
|
Existing patents |
|
7,751 |
7,998 |
8,884 |
8,931 |
9,427 |
|
Knowledge management |
(number) |
2009 |
2010 |
2011 |
2012 |
2013 |
|
|
|
|
|
|
|
|
|
Knowledge community/network by application sector |
|
44 |
53 |
58 |
63 |
65 |
|
- business |
|
38 |
48 |
53 |
53 |
55 |
|
- transversal |
|
6 |
5 |
5 |
10 |
10 |
|
Participants in knowledge community/ network by application sector |
|
1,827 |
2,624 |
3,634 |
4,732 |
5,676 |
|
- business |
|
1,601 |
2,385 |
3,376 |
4,098 |
4,909 |
|
- transversal |
|
226 |
239 |
258 |
634 |
767 |