operating review
performance in 2015
Scroll down for more content
Exploration & Production
of discovered resources at cost of less than one $/boe
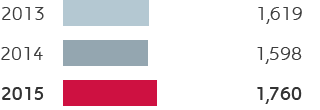
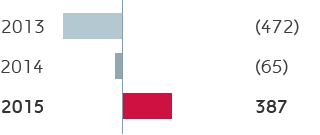
Adjusted operating profit (€ million)

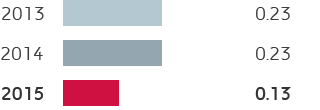
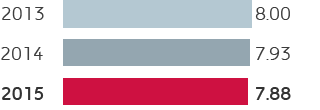
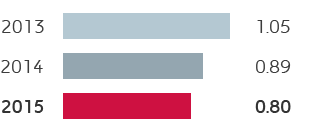
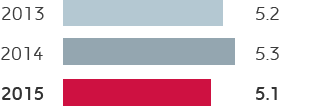
Opex per boe ($/boe)
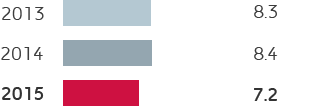

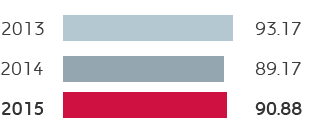
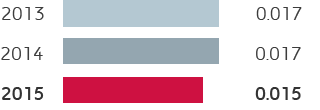
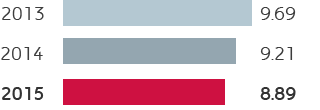
CO2eq emissions/operated production (tons C02eq/kboe)

the highest increase rate since 2001
in 2015
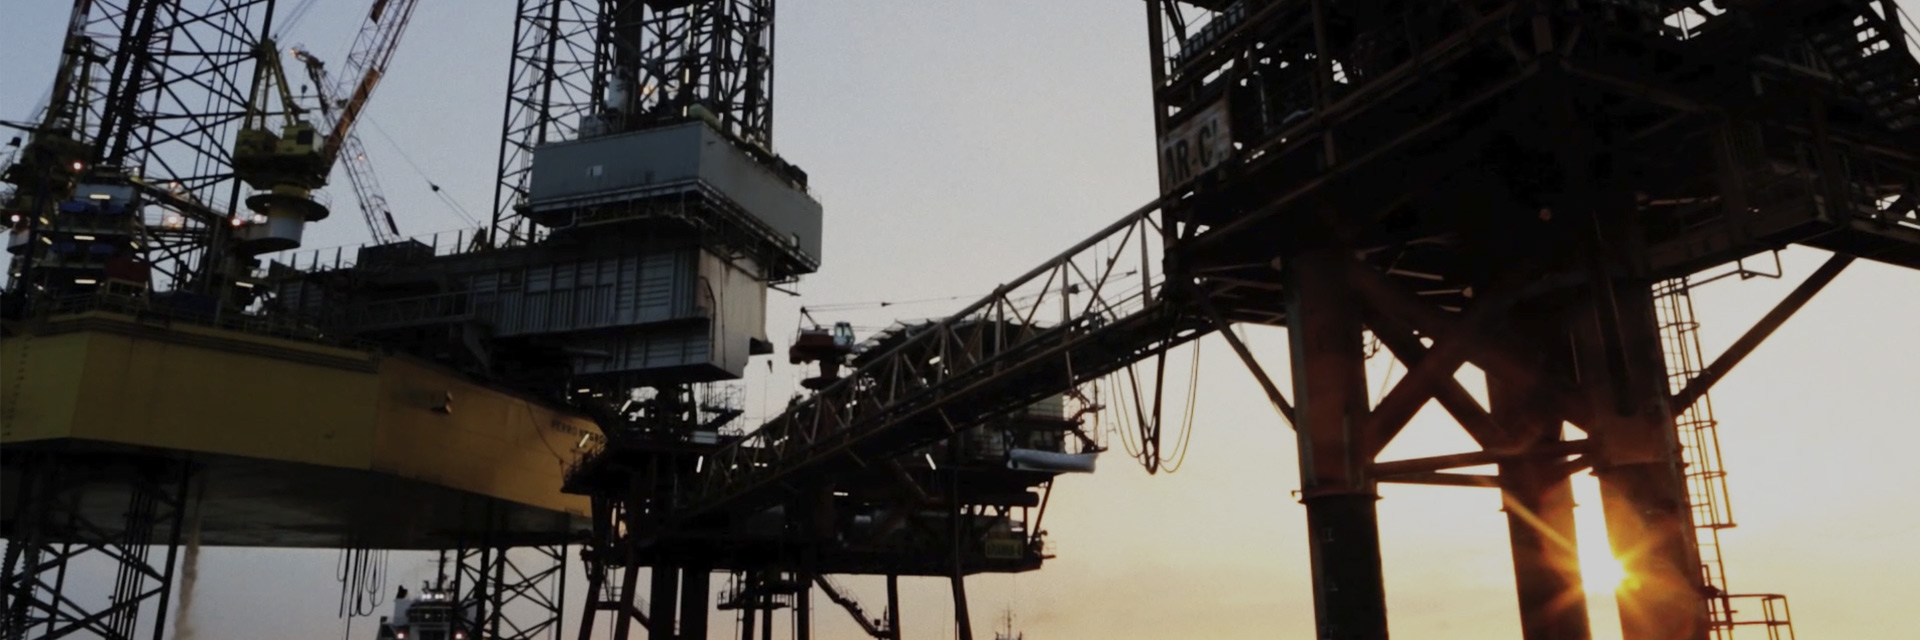
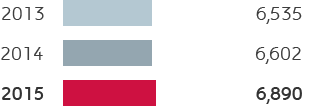
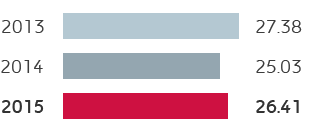
Hydrocarbons production (kboe/d)

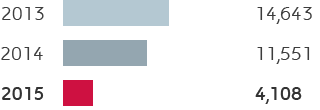
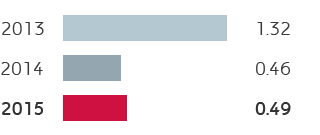
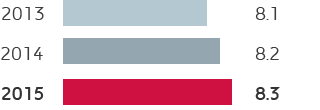
Injury frequency rate (No. of accidents per million worked hours)

Proved hydrocarbons reserves (mmboe)

opex decrease due to efficiency improvements
of development expenditure (-12% net of exchange rate effects)
Exploration discoveries
Gas & Power
Close to
break-even,in line with expectations
Ongoing the
full alignmentof supply portfolio to market conditions
Adjusted operating profit (€ million)

Injury frequency rate (No. of accidents per million of worked hours)

Worldwide gas sales (bcm)

About
10 millioncustomers including households, professionals, small and medium-sized enterprises and public bodies in Italy and in the Rest of Europe
Customers in Italy (million)

LNG sales (bcm)

Water withdrawals (cm/KWeq)

Refining & Marketing
about
5$/bladjusted operating profit anticipating strategic plan
Adjusted operating profit (€ million)

Injury frequency rate (No. of accidents per million of worked hours)

Refinery throughputs on own account (mmtonnes)

Direct GHG emissions (mmtonnes CO2eq)

Retail sales of refined products in Europe (mmtonnes)

Customer satisfaction index (likert scale)

vs 2014
through licensing agreement
Discontinued operations
Saipem disposal
On January 22, 2016, there was the closing of the agreements signed on October 27, 2015 with Fondo Strategico Italiano (FSI). Those include the sale of the 12.503% stakeof the share capital of Saipem to FSI and the concurrent entrance into force of the shareholder agreement with Eni, which was intended to establish joint control over the former Eni’s subsidiary.
Versalis disposal
Negotiations are underway to define an agreement with an industrial partner who, by acquiring a controlling stake of Versalis SpA, would support Eni in implementing the industrial plan designed to upgrade this business.