Highlights 2015
In 2015, on the back of a weak Brent price scenario, Eni achieved remarkable results leveraging on its refocused portfolio, profitable growth in the upstream segment and cost efficiency programs.
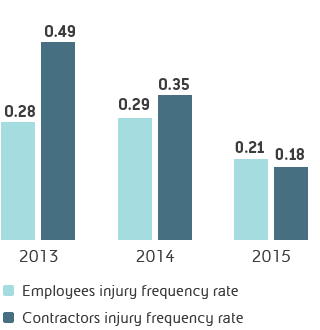
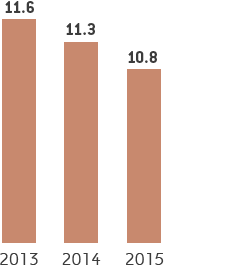
Injury frequency rate (No. of accidents per million of worked hours)

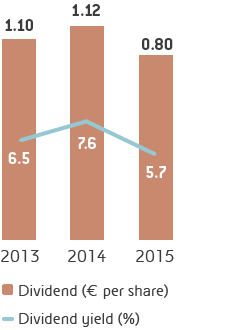
Dividend and dividend yield

Operating cash flow*
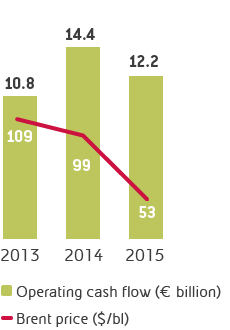

* Continuing operations on a standalone basis
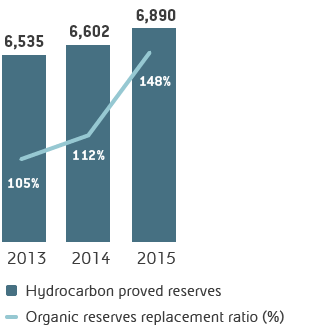
Proved reserves (million boe)

Capex* (€ billion)

* Continuing operations
Employees at period end* (number)
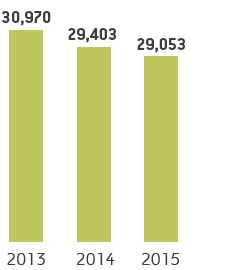

* Excluding Saipem and Versalis