performance
Scroll down for more content
Performance of the year
of discovered resources
in 2014-2016
at year end with a replacement ratio of 193%
Capex net of exchange rate effects
G&A
about 40% of 2016-2019 plan
Planned start-ups, 2016 ramp-ups and production optimization approximately
in 2020
down by
21%Start-up of Project Italia with
of capacity installed by 2022
GHG down by
per unit of production
down by
vs 2014 at 2025 target
- Financial highlights
- Summary financial data
-
Financial highlights(*)(**)
2014
2015
2016
(*)
Pertaining to continuing operations. Following the divestment of Saipem in January 2016, the results of the segment have been classified as discontinued operations based on the guidelines of IFRS 5. The comparative reporting periods have been restated consistently.
(**)
Effective January 1, 2016, management modified on voluntary basis the criterion to recognize exploration expenses adopting the accounting of the successful-effort-method (SEM). Accordingly, the comparative amounts disclosed for the FY 2016 have been restated. The retrospective application of the SEM has required adjustment of the opening balance of the retained earnings and other comparative amounts as of January 1, 2014. Specifically, the opening balance of the carrying amount of property, plant and equipment was increased by €3,524 million, intangible assets by €860 million and the retained earnings by €3,001 million. Other adjustments related to deferred tax liabilities and other minor line items. Concerning the FY 2015, the adoption of SEM determined a reduction of operating profit of €815 million. More information is disclosed in the notes of the consolidated financial statement of the 2016 Annual Report on Form 20-F.
(a)
Attributable to Eni’s shareholders.
(b)
Non-GAAP measures. Results of comparative periods are calculated on a standalone basis, i.e. by excluding the results of Saipem earned from both third parties and the Group’s continuing operations, therefore determining its deconsolidation.
(c)
The amount of dividends for the year 2016 is based on the Board’s proposal.
(d)
Number of outstanding shares by reference price at year end.
Net sales from operations
(€ million)
98,218
72,286
55,762
Operating profit (loss)
8,965
(3,076)
2,157
Adjusted operating profit (loss)(b)
11,223
4,486
2,315
Adjusted net profit (loss)(a)(b)
3,723
803
(340)
Net profit (loss)(a)
1,720
(7,952)
(1,051)
Net profit (loss) - discontinued operations(a)
(417)
(826)
(413)
Group net profit (loss)(a)
(continuing + discontinued operations)1,303
(8,778)
(1,464)
Comprehensive income(a)
6,817
(3,416)
819
Net cash flow from operating activities(b)
13,544
12,155
7,673
Capital expenditure
11,178
10,741
9,180
of which: exploration
1,030
566
417
development of hydrocarbon reserves
9,021
9,341
7,770
Dividends to Eni’s shareholders pertaining to the year(c)
4,037
2,880
2,881
Cash dividends to Eni’s shareholders
4,006
3,457
2,881
Total assets at year end
150,366
139,001
124,545
Shareholders’ equity including non-controlling interests at year end
65,641
57,409
53,086
Net borrowings at year end
13,685
16,871
14,776
Net capital employed at year end
79,326
74,280
67,862
of which: Exploration & Production
51,061
53,968
57,910
Gas & Power
9,031
5,803
4,100
Refining & Marketing and Chemicals
9,711
6,986
6,981
Share price at year end
(€)
14.5
13.8
15.5
Weighted average number of shares outstanding
(million)
3,610.4
3,601.1
3,601.1
Market capitalization(d)
(€ billion)
52
50
56
-
Summary financial data
2014
2015
2016
(a)
Fully diluted. Ratio of net profit/cash flow and average number of shares outstanding in the period. Dollar amounts are converted on the basis of the average EUR/USD exchange rate quoted by Reuters (WMR) for the period presented.
(b)
One American Depositary Receipt (ADR) is equal to two Eni ordinary shares.
(c)
Ratio of dividend for the period and the average price of Eni shares as recorded in December.
Net profit (loss) - continuing operations
- per share(a)
(€)
0.48
(2.21)
(0.29)
- per ADR(a)(b)
($)
1.27
(4.90)
(0.65)
Adjusted net profit (loss) - continuing operations
- per share(a)
(€)
1.16
0.37
(0.09)
- per ADR(a)(b)
($)
3.08
0.82
(0.20)
Cash flow - continuing operations
- per share(a)
(€)
4.01
3.58
2.13
- per ADR(a)(b)
($)
10.66
7.95
4.72
Adjusted Return on average capital employed (ROACE)
(%)
5.8
1.8
0.2
Leverage
21
29
28
Coverage
7.7
(2.4)
2.4
Current ratio
1.5
1.4
1.4
Debt coverage
105.7
76.3
51.9
Dividends pertaining to the year
(€ per share)
1.12
0.80
0.80
Total Share Return (TSR)
(%)
(11.9)
1.1
19.2
Pay-out
310
(33)
(197)
Dividend yield(c)
(%)
7.6
5.7
5.4
|
Operating and sustainability data(a) |
||||||||||
|
|
|
|
|
|
||||||
|
|
|
2014 |
2015 |
2016 |
||||||
|
||||||||||
|
Employees at year end |
(number) |
34,846 |
34,196 |
33,536 |
||||||
|
of which: women |
|
8,076 |
7,960 |
7,700 |
||||||
|
outside Italy |
|
13,639 |
13,316 |
12,626 |
||||||
|
Local employees outside Italy |
(%) |
86 |
85 |
85 |
||||||
|
Female managers (senior managers and managers) |
(%) |
23 |
24 |
24 |
||||||
|
Pay gap (women vs men) |
(%) |
97 |
97 |
97 |
||||||
|
TRIR (Total Recordable Injury Rate) |
(recordable injuries/worked hours) x 1,000,000 |
0.71 |
0.45 |
0.35 |
||||||
|
of which: employees |
|
0.56 |
0.41 |
0.36 |
||||||
|
contractors |
|
0.79 |
0.47 |
0.35 |
||||||
|
Fatality index (employees and contractors) |
(Fatal injuries per one hundred millions of worked hours) |
1.03 |
1.46 |
0.72 |
||||||
|
Near miss(b) |
(number) |
1,729 |
1,489 |
1,644 |
||||||
|
Training expenditures |
(€ million) |
39.1 |
29.1 |
26.6 |
||||||
|
Training hours |
(thousand hours) |
1,213 |
1,099 |
939 |
||||||
|
of which: e-learning |
|
120 |
183 |
197 |
||||||
|
Total volume of oil spills (> 1 barrel) |
(barrels) |
15,562 |
16,481 |
5,648 |
||||||
|
of which: due to sabotage and terrorism |
|
14,401 |
14,847 |
4,489 |
||||||
|
operational |
|
1,161 |
1,634 |
1,159 |
||||||
|
Direct GHG emissions |
(mmtonnes CO2eq) |
42.02 |
41.56 |
40.10 |
||||||
|
of which: CO2 equivalent from combustion and process |
|
30.92 |
31.49 |
30.60 |
||||||
|
CO2 equivalent from flaring |
|
5.73 |
5.51 |
5.40 |
||||||
|
CO2 equivalent from non-combusted methane and fugitive emissions |
|
3.48 |
2.77 |
2.42 |
||||||
|
CO2 equivalent from venting |
|
1.89 |
1.80 |
1.67 |
||||||
|
Total water withdrawals |
(mmcm) |
1,874 |
1,805 |
1,851 |
||||||
|
of which: sea water |
|
1,704 |
1,634 |
1,710 |
||||||
|
fresh water |
|
160 |
157 |
130 |
||||||
|
salt/salty water from subsoil or surface |
|
10 |
13 |
12 |
||||||
|
R&D expenditure(c) |
(€ million) |
174 |
176 |
161 |
||||||
|
of which: new energy |
|
|
|
51 |
||||||
|
First patent filing applications |
(number) |
64 |
33 |
40 |
||||||
|
of which: filed on renewable sources |
|
29 |
16 |
12 |
||||||
|
Number of suppliers used |
(number) |
13,145 |
11,380 |
10,041 |
||||||
|
Total procurement |
(€ million) |
24,068 |
20,350 |
13,249 |
||||||
|
of which: local procurement |
|
15,183 |
13,412 |
10,390 |
||||||
|
Interventions on the territory based on agreements, conventions and PSAs (Community investment) |
|
65 |
75 |
67 |
||||||
- Exploration & Production
- Gas & Power
- Refining & Marketing and Chemicals
-
Exploration & Production
2014
2015
2016
(a)
Includes Eni's share in joint ventures and equity-accounted entities.
(b)
Related to consolidated subsidiaries.
(c)
Three-year average.
(d)
Hydrocarbon production from fields fully operated by Eni (Eni's interest 100%) amounting to 122 mln toe, 125 mln toe and 117 mln toe in 2016, 2015 and 2014, respectively.
Employees at year end
(number)
12,777
12,821
12,494
TRIR (Total Recordable Injury Rate)
(recordable injuries/worked hours) x 1,000,000
0.56
0.34
0.34
of which: employees
0.20
0.22
0.34
contractors
0.68
0.39
0.34
Net proved reserves of hydrocarbons
(mmboe)
6,602
6,890
7,490
Average reserve life index
(years)
11.3
10.7
11.6
Hydrocarbon production(a)
(kboe/d)
1,598
1,760
1,759
Organic reserve replacement ratio
112
148
193
Profit per boe(b)(c)
($/boe)
14.5
7.4
2.7
Opex per boe(b)
8.4
7.2
6.2
Cash flow per boe
30.1
20.9
12.9
Finding & Development cost per boe(c)
21.5
19.3
13.2
Direct GHG emissions
(mmtonnes CO2eq)
23.4
22.8
20.4
CO2 emissions/100% operated hydrocarbon gross production(d)
(tonnes CO2eq/toe)
0.201
0.182
0.166
% produced water re-injected
(%)
56
56
58
Volumes of hydrocarbon sent to flaring
(mmcm)
1,767
1,989
1,950
of which: sent to flaring process
1,678
1,564
1,530
Oil spills due to operations (> 1 barrel)
(barrels)
936
1,177
1,025
Interventions on the territory based on agreements, conventions and PSAs (Community investment)
63
72
63
-
Gas & Power
2014
2015
2016
(a)
Pertaining to continuing operations.
(b)
The average evaluation reflects results of customers interviews based on clarity, courtesy and waiting time.
Employees at year end
(number)
4,561
4,484
4,261
TRIR (Total Recordable Injury Rate)
(recordable injuries/worked hours) x 1,000,000
0.82
0.89
0.28
of which: employees
0.87
0.91
0.27
contractors
0.70
0.81
0.31
Worldwide gas sales
(bcm)
89.17
90.88
88.93
- in Italy
34.04
38.44
38.43
- outside Italy
55.13
52.44
50.50
Customers in Italy
(million)
7.9
7.9
7.8
Direct GHG emissions
(mmtonnes CO2eq)
10.12
10.57
11.22
GHG emissions/kWheq (EniPower)
(gCO2eq/kWheq)
409
409
398
Installed capacity power plants
(GW)
5.3
4.9
4.7
Electricity produced
(TWh)
19.55
20.69
21.78
Electricity sold
33.58
34.88
37.05
Customer satisfaction rate(b)
(scale from 0 to 100)
81.4
85.6
86.2
-
Refining & Marketing and Chemicals
2014
2015
2016
(a)
2014 data includes Livorno, Sannazzaro, Taranto and Gela; 2015 data refers to Livorno, Sannazzaro and Taranto.
Employees at year end
(number)
11,884
10,995
10,858
TRIR (Total Recordable Injury Rate)
(recordable injuries/worked hours) x 1,000,000
1.51
1.07
0.38
of which: employees
1.60
0.97
0.44
contractors
1.40
1.17
0.32
Oil spills due to operations (> 1 barrel)
(barrels)
225
427
134
Direct GHG emissions
(mmtonnes CO2eq)
8.45
8.19
8.50
SOx emissions (sulphur oxide)
(ktonnes SO2eq)
6.84
6.17
4.35
Refinery throughputs on own account
(mmtonnes)
25.03
26.41
24.52
Retail market share in Italy
(%)
25.5
24.5
24.3
Retail sales of petroleum products in Europe
(mmtonnes)
9.21
8.89
8.59
Service stations in Europe at year end
(number)
6,220
5,846
5,622
Average throughput of service stations in Europe
(kliters)
1,725
1,754
1,742
Balanced capacity of refineries
(kbbl/d)
617
548
548
Capacity of biorefineries
(ktonnes/year)
360
360
360
Production of biofuels
(ktonnes)
105
179
191
GHG emissions/refining throughputs (traditional refineries)(a)
(tonnes CO2eq/kt)
287
237
272
Production of petrochemical products
(ktonnes)
5,283
5,700
5,646
Sales of petrochemical products
3,463
3,801
3,759
Average plant utilization rate
(%)
71
73
72
A life offshore on the Garibaldi C
Work on the platform: Eni’s people talk about their life offshore. Security is always on top of the priorities. Collaboration is very important: people share knowledge and experience.
Financial review
Capital expenditure |
|
|
|||
|
|
|
|
|
|
(€ million) |
2014 |
2015 |
2016 |
Change |
% Ch. |
Exploration & Production |
10,156 |
9,980 |
8,254 |
(1,726) |
(17.3) |
- acquisition of proved and unproved properties |
|
|
2 |
|
|
- exploration |
1,030 |
566 |
417 |
|
|
- development |
9,021 |
9,341 |
7,770 |
|
|
- other expenditure |
105 |
73 |
65 |
|
|
Gas & Power |
172 |
154 |
120 |
(34) |
(22.1) |
Refining & Marketing and Chemicals |
819 |
628 |
664 |
36 |
5.7 |
- Refining & Marketing |
537 |
408 |
421 |
13 |
3.2 |
- Chemicals |
282 |
220 |
243 |
23 |
10.5 |
Corporate and other activities |
113 |
64 |
55 |
(9) |
(14.1) |
Impact of unrealized intragroup profit elimination |
(82) |
(85) |
87 |
172 |
.. |
Capital expenditure - continuing operations |
11,178 |
10,741 |
9,180 |
(1,561) |
(14.5) |
Capital expenditure - discontinued operations |
694 |
561 |
|
(561) |
|
Capital expenditure |
11,872 |
11,302 |
9,180 |
(2,122) |
(18.8) |
Adjusted results |
|||||
|
|
|
|
|
|
(€ million) |
2014 |
2015 |
2016 |
Change |
% Ch. |
Adjusted operating profit (loss) - continuing operations |
12,337 |
5,708 |
2,315 |
(3,393) |
(59.4) |
Reinstatement of intercompany transactions vs. discontinued operations |
(1,114) |
(1,222) |
|
|
|
Adjusted operating profit (loss) - continuing operations on a standalone basis |
11,223 |
4,486 |
2,315 |
(2,171) |
(48.4) |
|
|
|
|
|
|
Net profit (loss) attributable to Eni’s shareholders - continuing operations |
1,720 |
(7,952) |
(1,051) |
6,901 |
86.8 |
Exclusion of inventory holding (gains) losses |
1,008 |
782 |
(120) |
|
|
Exclusion of special items |
1,471 |
8,487 |
831 |
|
|
Adjusted net profit (loss) attributable to Eni’s shareholders - continuing operations |
4,199 |
1,317 |
(340) |
(1,657) |
.. |
Reinstatement of intercompany transactions vs. discontinued operations |
(476) |
(514) |
|
|
|
Adjusted net profit (loss) attributable to Eni’s shareholders on a standalone basis |
3,723 |
803 |
(340) |
(1,143) |
.. |
Tax rate (%) |
65.9 |
82.4 |
120.6 |
|
|
Summarized Group Balance Sheet
The Summarized Group Balance Sheet aggregates the amount of assets and liabilities derived from the statutory balance sheet in accordance with functional criteria which consider the enterprise conventionally divided into the three fundamental areas focusing on resource investments, operations and financing. Management believes that this summarized Group Balance Sheet is useful information in assisting investors to assess Eni’s capital structure and to analyze its sources of funds and investments in fixed assets and working capital. Management uses the summarized group balance sheet to calculate key ratios such as the proportion of net borrowings to shareholders’ equity (leverage) intended to evaluate whether Eni’s financing structure is sound and well-balanced.
Summarized Group Balance Sheet |
|||
|
|
|
|
(€ million) |
December 31, 2015 |
December 31, 2016 |
Change |
Fixed assets |
|
|
|
Property, plant and equipment |
68,005 |
70,793 |
2,788 |
Inventories - Compulsory stock |
909 |
1,184 |
275 |
Intangible assets |
3,034 |
3,269 |
235 |
Equity-accounted investments and other investments |
3,513 |
4,316 |
803 |
Receivables and securities held for operating purposes |
2,273 |
1,932 |
(341) |
Net payables related to capital expenditure |
(1,284) |
(1,765) |
(481) |
|
76,450 |
79,729 |
3,279 |
Net working capital |
|
|
|
Inventories |
4,579 |
4,637 |
58 |
Trade receivables |
12,616 |
11,186 |
(1,430) |
Trade payables |
(9,605) |
(11,038) |
(1,433) |
Tax payables and provisions for net deferred tax liabilities |
(4,137) |
(3,073) |
1,064 |
Provisions |
(15,375) |
(13,896) |
1,479 |
Other current assets and liabilities |
1,827 |
1,171 |
(656) |
|
(10,095) |
(11,013) |
(918) |
Provisions for employee post-retirement benefits |
(1,123) |
(868) |
255 |
Discontinued operations and assets held for sale including related liabilities |
9,048 |
14 |
(9,034) |
CAPITAL EMPLOYED, NET |
74,280 |
67,862 |
(6,418) |
Eni shareholders’ equity |
55,493 |
53,037 |
(2,456) |
Non-controlling interest |
1,916 |
49 |
(1,867) |
Shareholders’ equity |
57,409 |
53,086 |
(4,323) |
Net borrowings |
16,871 |
14,776 |
(2,095) |
TOTAL LIABILITIES AND SHAREHOLDERS’ EQUITY |
74,280 |
67,862 |
(6,418) |
The Summarized Group Balance Sheet was affected by the movement in the EUR/USD exchange rate, which determined an increase in net capital employed, total equity and net borrowings by €1,747 million, €1,198 million, and €549 million respectively. This was due to translation into euros of the financial statements of US-denominated subsidiaries reflecting a 3.2% depreciation of the euro against the US dollar (1 EUR= 1.054 USD at December 31, 2016 compared to 1.089 at December 31, 2015).
Fixed assets (€79,729 million) increased by €3,279 million from December 31, 2015. The item “Property, plant and equipment” was up by €2,788 million mainly due to capital expenditure (€9,180 million), positive currency movements and net asset impairments reversals (€475 million). These positives were offset by DD&A (€7,559 million), the write-off of exploration projects lacking the criteria for continuing to be capitalized and the write-off of the damaged units of the EST plant in Sannazzaro refinery (€350 million). The increase in the item “Equity-accounted investments and other investments” of €803 million was due to the recognition as an equity-accounted investment of the stake of 30.55% retained in Saipem following loss of control over the former subsidiary and the pro-quota share capital increase of Saipem subscribed by for an overall amount of €1,614 million, net of losses incurred in the period.
Net working capital was in negative territory at minus €11,013 million and decreased by €918 million y-o-y driven by reduced trade receivables, due to better management of working capital and higher volume of trade receivables due beyond end of the reporting period which were transferred to factoring institution, as well as increased trade payables. Other current assets and liabilities decreased due mainly to the impairment of certain receivables in the E&P segment owed by certain NOCs, due to the expected outcome of ongoing negotiations in relation to under-lifting position.
These negatives were partly offset by the decrease in tax payables and provisions for deferred taxes, reflecting lower provisions for current tax, driven by the reduction of taxable profit and E&P utilization of deferred tax liabilities relating to the impairment of under-lifting receivables, as well as the reduction in the risk provisions for the fulfilment of obligations.
Discontinued operations, assets held for sale including related liabilities (€14 million) decreased by €9,034 million due to the closing of the Saipem transaction and the divestment of fuel distribution activities in Eastern Europe.
Shareholders’ equity including non-controlling interest was €53,086 million, down by €4,323 million from December 31, 2015. This was due to the net loss of the year (€1,457 million), the de-recognition of Saipem non-controlling interest (€1,872 million), as well as dividend distribution and other changes of €2,885 million (including the 2015 balance and the 2016 interim dividends paid to Eni’s shareholders amounting to €2,881 million). These effects were partially offset by a positive change in the cash flow hedge reserve (€883 million) and positive foreign currency translation differences (€1,198 million).
Summarized Group Cash Flow Statement
Eni’s Summarized Group Cash Flow Statement derives from the statutory statement of cash flows. It enables investors to understand the link existing between changes in cash and cash equivalents (deriving from the statutory cash flows statement) and in net borrowings (deriving from the summarized cash flow statement) that occurred from the beginning of the period to the end of period. The measure enabling such a link is represented by the free cash flow which is the cash in excess of capital expenditure needs. Starting from free cash flow it is possible to determine either: (i) changes in cash and cash equivalents for the period by adding/deducting cash flows relating to financing debts/receivables (issuance/repayment of debt and receivables related to financing activities), shareholders’ equity (dividends paid, net repurchase of own shares, capital issuance) and the effect of changes in consolidation and of exchange rate differences; and (ii) change in net borrowings for the period by adding/deducting cash flows relating to shareholders’ equity and the effect of changes in consolidation and of exchange rate differences. The free cash flow and net cash provided by operating activities from continuing operations on a standalone basis are non-GAAP measures of financial performance.
Summarized Group Cash Flow Statement |
||||
|
|
|
|
|
(€ million) |
2014 |
2015 |
2016 |
Change |
Net profit (loss) - continuing operations |
1,808 |
(7,399) |
(1,044) |
6,355 |
Adjustments to reconcile net profit (loss) to net cash provided by operating activities: |
|
|
|
|
- depreciation, depletion and amortization and other non monetary items |
10,898 |
17,216 |
7,773 |
(9,443) |
- net gains on disposal of assets |
(224) |
(577) |
(48) |
529 |
- dividends, interests, taxes and other changes |
6,600 |
3,215 |
2,229 |
(986) |
Changes in working capital related to operations |
2,199 |
4,781 |
2,112 |
(2,669) |
Dividends received, taxes paid, interests (paid) received during the period |
(6,812) |
(4,361) |
(3,349) |
1,012 |
Net cash provided by operating activities - continuing operations |
14,469 |
12,875 |
7,673 |
(5,202) |
Net cash provided by operating activities - discontinued operations |
273 |
(1,226) |
|
1,226 |
Net cash provided by operating activities |
14,742 |
11,649 |
7,673 |
(3,976) |
Capital expenditure - continuing operations |
(11,178) |
(10,741) |
(9,180) |
1,561 |
Capital expenditure - discontinued operations |
(694) |
(561) |
|
561 |
Capital expenditure |
(11,872) |
(11,302) |
(9,180) |
2,122 |
Investments and purchase of consolidated subsidiaries and businesses |
(408) |
(228) |
(1,164) |
(936) |
Disposals of consolidated subsidiaries, businesses, tangible and intangible assets and investments |
3,684 |
2,258 |
1,054 |
(1,204) |
Other cash flow related to capital expenditure, investments and disposals |
435 |
(1,351) |
465 |
1,816 |
Free cash flow |
6,581 |
1,026 |
(1,152) |
(2,178) |
New borrowings (repayment) of long-term finance debt |
(414) |
(300) |
5,271 |
5,571 |
Changes in short and long-term financial debt |
(628) |
2,126 |
(766) |
(2,892) |
Dividends paid and changes in non-controlling interests and reserves |
(4,434) |
(3,477) |
(2,885) |
592 |
Effect of changes in consolidation, exchange differences and cash and cash equivalent related to discontinued operations |
78 |
(780) |
(3) |
777 |
NET CASH FLOW |
1,183 |
(1,405) |
465 |
1,870 |
Net cash provided by operating activities on a standalone basis |
13,544 |
12,155 |
7,673 |
(4,482) |
Change in net borrowings |
||||
|
|
|
|
|
(€ million) |
2014 |
2015 |
2016 |
Change |
Free cash flow |
6,581 |
1,026 |
(1,152) |
(2,178) |
Net borrowings of acquired companies |
(19) |
|
|
|
Net borrowings of divested companies |
|
83 |
5,848 |
5,765 |
Exchange differences on net borrowings and other changes |
(850) |
(818) |
284 |
1,102 |
Dividends paid and changes in non-controlling interest and reserves |
(4,434) |
(3,477) |
(2,885) |
592 |
CHANGE IN NET BORROWINGS |
1,278 |
(3,186) |
2,095 |
5,281 |
Results by segment
Exploration & Production
In 2016, the Exploration & Production segment reported an adjusted operating profit of €2,494 million, down by 40.4% y-o-y. The €1,688 million decline mainly reflected a weaker commodity environment, with the marker Brent down by 16.7% and declining gas prices in Europe and the United States. Profit for the year was also negatively affected by the Val d’Agri shutdown, which lasted four months and half. These effects were only partially offset by higher production in other areas and lower operating expenses and DD&A. This latter was due to lower capital expenditure and the reduction in the carrying amounts of oil&gas properties following the material impairment losses booked last year (€5,212 million).
Adjusted operating profit excluded a positive adjustment of €73 million and related to asset revaluations of €1,440 million at oil&gas properties driven by an upward revision to management’s long-term assumption for the benchmark Brent price to $70 per barrel from the previous $65 adopted in the financial projections of the 2017-2020 industrial plan. These were absorbed by: (i) impairment losses of gas properties driven by a lowered price outlook in Europe and other oil&gas properties due to contractual changes, reserves revision and a higher country risk (overall amount of €756 million); and (ii) other charges of €461 million mainly relating to the impairment of certain overdue receivables owed by national oil companies due to the expected outcome of ongoing negotiations. The recognition of those receivables as deductible items for tax purposes resulted in the reversal of unused deferred tax liabilities of €380 million.
For the FY2016, adjusted net profit amounted to €508 million, a decline of €483 million, or 48.7%, from 2015 due to a lower operating performance.
In 2016, taxes paid represented approximately 32% of the cash flow from operating activities of the E&P segment before changes in working capital and income taxes paid.
Gas & Power
In 2016, the Gas & Power segment reported an adjusted operating loss of €390 million, down by €264 million y-o-y. This reflected lower margins on LNG sales and higher one-off benefits from contracts renegotiations reported in 2015, partly offset by logistic costs optimizations and better performance in trading activities. The retail segment reported lower results due to unusual winter weather conditions.
Adjusted operating loss excluded a loss on stock of €90 million and net special gains of €89 million. Special gains comprised the effects of the fair-value evaluation of certain commodity derivatives lacking the formal criteria to be accounted as hedges under IFRS (gains of €443 million), a downward revision of revenues accrued on the sale of gas and power for past reporting periods, resulting from the restructuring plan launched in 2015 (€161 million), the impairment loss of certain assets due to the increased country risk and the weakness of the scenario (€81 million). Adjusted operating result included a negative balance of €19 million of exchange rate differences and derivatives.
In the full year, the Gas & Power segment reported an adjusted net loss of €330 million due to the reduction of operating performance.
Refining & Marketing and Chemicals
In 2016, the Refining & Marketing and Chemicals segment reported an adjusted operating profit of €583 million, declining by €112 million from the previous year.
The Refining & Marketing business reported an adjusted operating profit of €278 million, down by €109 million, or 28.2% compared to 2015. This decline was driven by an unfavorable refining margin scenario (the Eni’s standard refining margin – SERM – was down by 49.4% to 4.2 $/bbl in 2016 from 8.3 $/bbl in 2015), as well as, the scheduled maintenance activities at certain refineries. The refining break-even margin improved to 4.2 $/bbl, better than the planned target of 4.5 $/bbl. These negatives were partly offset by improved plant optimization and efficiency. Moreover, marketing recorded lower results reflecting weaker margins due to stronger competitive pressure and the subsidiaries disposal in Slovenia and Hungary.
The Chemical business reported an adjusted operating profit of €305 million, almost unchanged y-o-y, due to an unfavorable trading environment, which hit commodity margins, mainly in feedstocks, polyethylenes and styrenics, and competitive pressure. The result also reflected lower products availability following unplanned shutdowns.
These negatives were offset by efficiency actions implemented in previous years and reduction in depreciation due to the asset impairment recorded in 2015 to align assets book value to their fair value.
Special charges excluded from adjusted operating profit amounted to a net positive of €266 million. This included impairment losses to write down capital expenditure of the period at assets impaired in previous reporting periods (€104 million), environmental charges (€104 million) as well as fair-value evaluation of certain commodity derivatives (charges of €3 million) lacking the formal criteria to be accounted as hedges under IFRS. Furthermore, special charges include the write-off related to the EST conversion plant, at Sannazzaro Refinery, affected by the event occurred in December 2016, and the environmental provision for removal and clean-up (a total amount of €217 million), partially offset by the insurance compensation paid by third parties which was recognized virtually certain at the closing date (€122 million).
Adjusted net profit of €419 million reduced by €93 million reflecting the operating performance.
|
Adjusted operating profit by segment |
|
||||||
|
|
|
|
|
|
|
||
|
(€ million) |
2014 |
2015 |
2016 |
Change |
% Ch. |
||
|
|||||||
|
Exploration & Production |
11,679 |
4,182 |
2,494 |
(1,688) |
(40.4) |
||
|
Gas & Power |
168 |
(126) |
(390) |
(264) |
.. |
||
|
Refining & Marketing and Chemicals |
(412) |
695 |
583 |
(112) |
(16.1) |
||
|
Corporate and other activities |
(443) |
(369) |
(452) |
(83) |
(22.5) |
||
|
Impact of unrealized intragroup profit elimination(a) |
1,345 |
1,326 |
80 |
(1,246) |
|
||
|
Adjusted net profit (loss) - continuing operations |
12,337 |
5,708 |
2,315 |
(3,393) |
(59.4) |
||
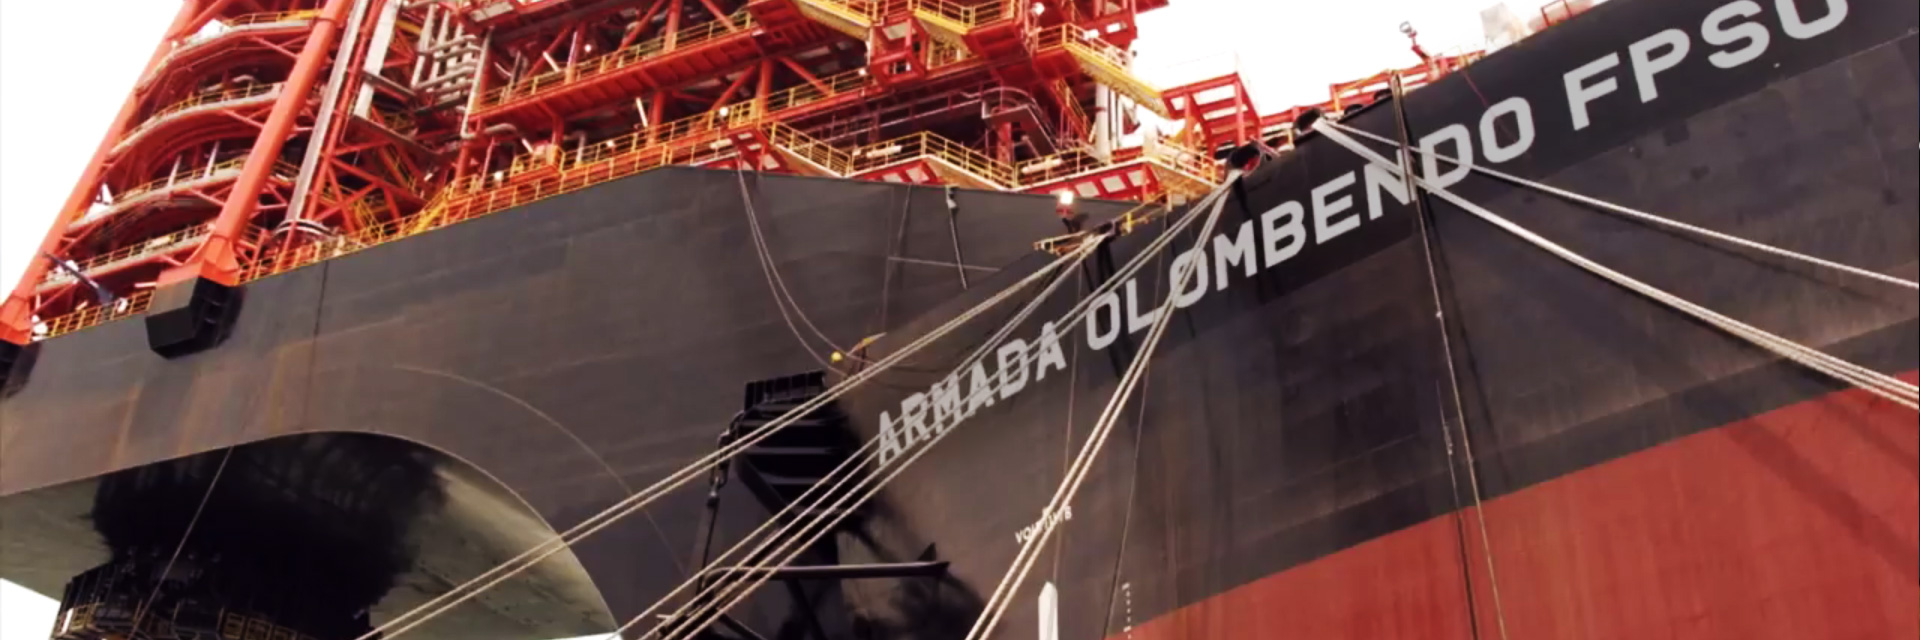
Aboard of Armada Olombendo - East Hub Development Project
A time-to-market among the best in the sector. In just three years from the development plan Cabaça South East field starts production: an achievement that will increase total production from the prolific 15/06 field to 150,000 barrels per day.
Outlook
Management’s forecasts for the Group’s 2017 production and sale metrics are disclosed in this section.
Goliat the Giant - The Start of Production
In an ice-free zone, off the coast of Norway, Eni begins production at Goliat: the first oil reservoir to enter production in the Barents Sea. Goliat has been developed using the world’s largest and most sophisticated cylindrical floating production and storage unit (FPSO), built with the most advanced technologies to address the technical challenges of operating in an Arctic environment.
Risk factors and uncertainties
The risks described in this section may have a material effect on our operational and financial performance. We invite our investors to consider these risks carefully.