Refining & Marketing
Refining capacity
-30%
vs 2012
due to reconversion in biofuel plants
Production capacity
0.3
milion tonnes/year
of Venice Green Refinery
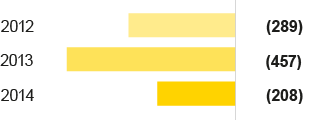
Adjusted operating profit
(€ million)

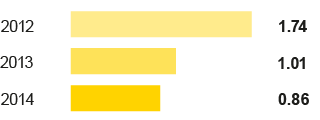
Injury frequency rate
(No. of accidents per million of worked hours)

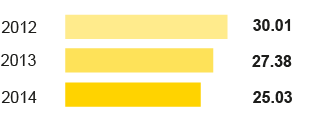
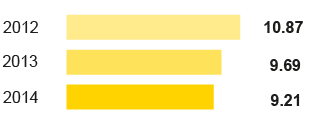
Refinery throughputs on own account
(mmtonnes)

Biofuels marketed
+2.09
milion tonnes
Refinery utilization rate
78%
with a $6/barrel breakeven margin
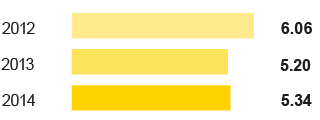
Direct GHG emissions
(mmtonnes CO2eq)

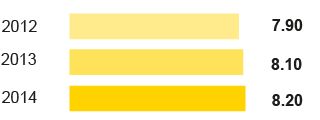
Retail sales of petroleum products in Europe
(mmtonnes)

Customer satisfaction index
(likert scale)

Agreement for the conversion of
Gela Refinery
in bio-refinery
Standard Eni Refining Margin
+32.1%
vs 2013
not withstanding industry structural headwinds