Highlights 2014
In 2014, in spite of an unfavourable trading environment, Eni delivered excellent results underpinned by record cash flow generation. The performance was driven by the increased contribution from upstream production and the accelerated restructuring of the mid and downstream businesses.
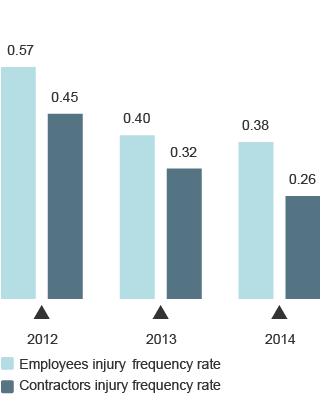
Injury frequency rate (No. of accidents per million of worked hours)

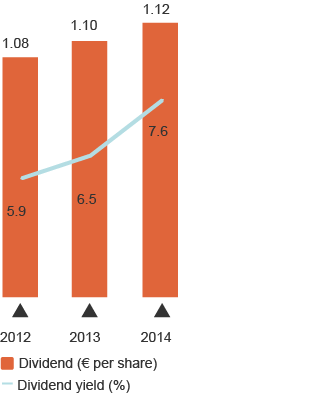
Dividend and dividend yield

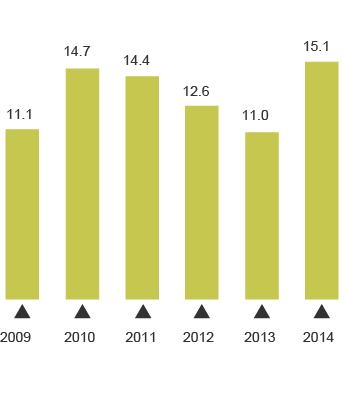
Operating cash ow(€ billion)

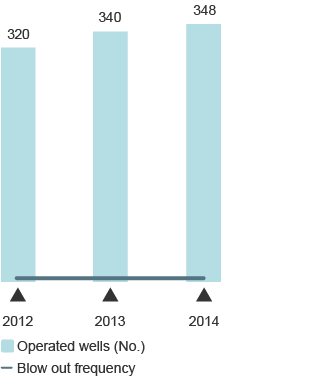
Operative e fficiency

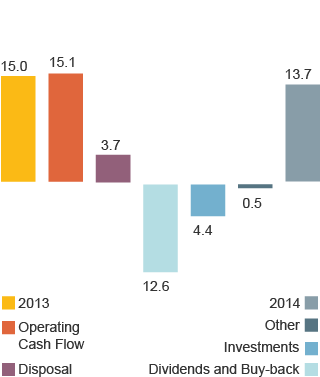
2014 net borrowings evolution(€ billion)

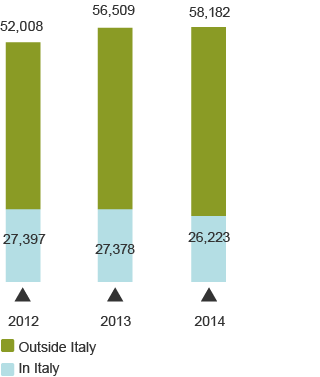
Employees at period end (number)