Marketing
Eni operates in a liberalized market where energy customers are allowed to choose the gas supplier and, according to their specific needs, to evaluate the quality of services and offers. Overall Eni supplies approximately 2,600 customers including large companies, power generation companies, wholesalers and distributors of natural gas for automotive use. Residential users are approximately 8 million and include households, professionals, small and medium sized enterprises, and public bodies located all over Italy and approximately 2 million customers in European Countries. In a context characterized by a six percentage points drop of demand in the Italian market (broadly in line in the European Union) due to declining consumption in all the reference segments and increased competitive pressure, Eni progressed a number of initiatives in order to mitigate the negative impact of the trading environment such as renegotiation of supply contracts, efficiency and optimization actions (for further information on the European scenario, see chapter “Risk factors”).
Worldwide gas sales (bcm)
Natural Gas
Supply of natural gas
In 2013, Eni’s consolidated subsidiaries supplied 85.67 bcm of natural gas, representing a decrease of 1.02 bcm, or 1.2% from 2012.
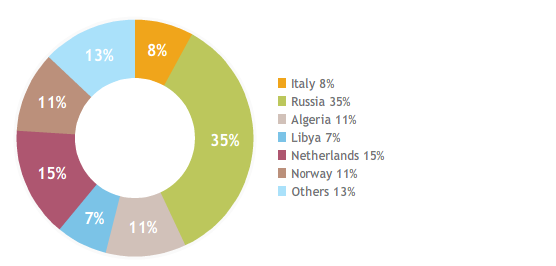
Gas volumes supplied outside Italy (78.52 bcm from consolidated companies), imported in Italy or sold outside Italy, represented approximately 92% of total supplies, were substantially in line with 2012 (down 0.62 bcm or 0.8%) due to higher volumes purchased in Russia (up 9.76 bcm) and the Netherlands (up 1.09 bcm), completely offset by lower volumes purchased in particular in Algeria (down 5.14 bcm), Norway (down 2.97 bcm) and Libya (down 0.77 bcm).
|
Supply of natural gas |
|||||
|
|
|
|
|
|
|
|
(bcm) |
2011 |
2012 |
2013 |
Change |
% Ch. |
|
Italy |
7.22 |
7.55 |
7.15 |
(0.40) |
(5.3) |
|
Russia |
21.00 |
19.83 |
29.59 |
9.76 |
49.2 |
|
Algeria (including LNG) |
13.94 |
14.45 |
9.31 |
(5.14) |
(35.6) |
|
Libya |
2.32 |
6.55 |
5.78 |
(0.77) |
(11.8) |
|
Netherlands |
11.02 |
11.97 |
13.06 |
1.09 |
9.1 |
|
Norway |
12.30 |
12.13 |
9.16 |
(2.97) |
(24.5) |
|
United Kingdom |
3.57 |
3.20 |
3.04 |
(0.16) |
(5.0) |
|
Hungary |
0.61 |
0.61 |
0.48 |
(0.13) |
(21.3) |
|
Qatar (LNG) |
2.90 |
2.88 |
2.89 |
0.01 |
0.3 |
|
Other supplies of natural gas |
6.16 |
5.43 |
3.63 |
(1.80) |
(33.1) |
|
Other supplies of LNG |
2.23 |
2.09 |
1.58 |
(0.51) |
(24.4) |
|
Outside Italy |
76.05 |
79.14 |
78.52 |
(0.62) |
(0.8) |
|
TOTAL SUPPLIES OF ENI’S CONSOLIDATED SUBSIDIARIES |
83.27 |
86.69 |
85.67 |
(1.02) |
(1.2) |
|
Off-take from (input to) storage |
1.79 |
(1.35) |
(0.58) |
0.77 |
.. |
|
Network losses, measurement differences and other changes |
(0.21) |
(0.28) |
(0.31) |
(0.03) |
(10.7) |
|
AVAILABLE FOR SALE BY ENI’S CONSOLIDATED SUBSIDIARIES |
84.85 |
85.06 |
84.78 |
(0.28) |
(0.3) |
|
Available for sale by Eni’s affiliates |
9.05 |
7.53 |
5.78 |
(1.75) |
(23.2) |
|
E&P volumes |
2.86 |
2.73 |
2.61 |
(0.12) |
(4.4) |
|
TOTAL AVAILABLE FOR SALE |
96.76 |
95.32 |
93.17 |
(2.15) |
(2.3) |
Supplies in Italy (7.15 bcm) slightly decreased from 2012 due to the decline of mature fields. In 2013, main gas volumes from equity production derived from: (i) Italian gas fields (6.1 bcm); (ii) Libyan fields (1.7 bcm); (iii) certain Eni fields located in the British and Norwegian sections of the North Sea (1.5 bcm); (iv) the United States (1.2 bcm); (v) other European areas (Croatia with 0.4 bcm).
Considering also direct sales of the Exploration & Production Division and LNG supplied from the Bonny liquefaction plant in Nigeria, supplied gas volumes from equity production were approximately 16 bcm representing 17% of total volumes available for sale.
Supplies of Eni’s consolidated subsidiaries (85.67 bcm)
Sales of natural gas
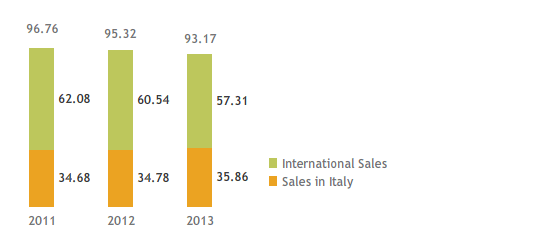
In 2013, Eni’s gas sales were 93.17 bcm, down by 2.3% from 2012. When excluding the effect of the divestment of Galp, gas sales were broadly in line with the previous year. Eni’s sales in the domestic market increased by 1.08 bcm driven by higher spot sales and by higher sales to importers in Italy (up 1.94 bcm). This positive trend was more than offset by lower volumes marketed in the main European markets (down 5.61 bcm, particularly in Benelux, the Iberian Peninsula and the UK) due to declining gas demand and competitive pressure. Higher sales outside Europe (up 0.56 bcm) were driven by increasing LNG sales in the Far East, particularly in Japan and Korea. Exploration & Production sales in Northern Europe and in the United States (2.61 bcm) declined by 0.12 bcm due to lower sales in the United States.
|
Gas sales by entity |
|||||
|
|
|
|
|
|
|
|
(bcm) |
2011 |
2012 |
2013 |
Change |
% Ch. |
|
Total sales of subsidiaries |
84.05 |
84.30 |
83.60 |
(0.70) |
(0.8) |
|
Italy (including own consumption) |
34.60 |
34.66 |
35.76 |
1.10 |
3.2 |
|
Rest of Europe |
44.84 |
44.57 |
42.30 |
(2.27) |
(5.1) |
|
Outside Europe |
4.61 |
5.07 |
5.54 |
0.47 |
9.3 |
|
Total sales of Eni’s affiliates (net to Eni) |
9.85 |
8.29 |
6.96 |
(1.33) |
(16.0) |
|
Italy |
0.08 |
0.12 |
0.10 |
(0.02) |
(16.7) |
|
Rest of Europe |
8.14 |
6.45 |
5.05 |
(1.40) |
(21.7) |
|
Outside Europe |
1.63 |
1.72 |
1.81 |
0.09 |
5.2 |
|
E&P in Europe and in the Gulf of Mexico |
2.86 |
2.73 |
2.61 |
(0.12) |
(4.4) |
|
WORLDWIDE GAS SALES |
96.76 |
95.32 |
93.17 |
(2.15) |
(2.3) |
|
Gas sales by market |
|||||
|
|
|
|
|
|
|
|
(bcm) |
2011 |
2012 |
2013 |
Change |
% Ch. |
|
ITALY |
34.68 |
34.78 |
35.86 |
1.08 |
3.1 |
|
Wholesalers |
5.16 |
4.65 |
4.58 |
(0.07) |
(1.5) |
|
Italian gas exchange and spot markets |
5.24 |
7.52 |
10.68 |
3.16 |
42.0 |
|
Industries |
7.21 |
6.93 |
6.07 |
(0.86) |
(12.4) |
|
Medium-sized enterprises and services |
0.88 |
0.81 |
1.12 |
0.31 |
38.3 |
|
Power generation |
4.31 |
2.55 |
2.11 |
(0.44) |
(17.3) |
|
Residential |
5.67 |
5.89 |
5.37 |
(0.52) |
(8.8) |
|
Own consumption |
6.21 |
6.43 |
5.93 |
(0.50) |
(7.8) |
|
INTERNATIONAL SALES |
62.08 |
60.54 |
57.31 |
(3.23) |
(5.3) |
|
Rest of Europe |
52.98 |
51.02 |
47.35 |
(3.67) |
(7.2) |
|
Importers in Italy |
3.24 |
2.73 |
4.67 |
1.94 |
71.1 |
|
European markets |
49.74 |
48.29 |
42.68 |
(5.61) |
(11.6) |
|
Iberian Peninsula |
7.48 |
6.29 |
4.90 |
(1.39) |
(22.1) |
|
Germany/Austria |
6.47 |
7.78 |
8.31 |
0.53 |
6.8 |
|
Benelux |
13.84 |
10.31 |
8.68 |
(1.63) |
(15.8) |
|
Hungary |
2.24 |
2.02 |
1.84 |
(0.18) |
(8.9) |
|
UK/Northern Europe |
4.21 |
4.75 |
3.51 |
(1.24) |
(26.1) |
|
Turkey |
6.86 |
7.22 |
6.73 |
(0.49) |
(6.8) |
|
France |
7.01 |
8.36 |
7.73 |
(0.63) |
(7.5) |
|
Other |
1.63 |
1.56 |
0.98 |
(0.58) |
(37.2) |
|
Extra European markets |
6.24 |
6.79 |
7.35 |
0.56 |
8.2 |
|
E&P in Europe and in the Gulf of Mexico |
2.86 |
2.73 |
2.61 |
(0.12) |
(4.4) |
|
WORLDWIDE GAS SALES |
96.76 |
95.32 |
93.17 |
(2.15) |
(2.3) |
LNG
In 2013, LNG sales (12.4 bcm) decreased by 2.2 bcm from 2012. In particular, LNG sales by the Gas & Power segment (8.4 bcm, included in worldwide gas sales) mainly concerned LNG from Qatar, Algeria and Nigeria marketed in Europe, South America and the Far East.
|
LNG sales |
|||||
|
|
|
|
|
|
|
|
(bcm) |
2011 |
2012 |
2013 |
Change |
% Ch. |
|
G&P sales |
11.8 |
10.5 |
8.4 |
(2.1) |
(20.0) |
|
|
|
|
|
|
|
|
Rest of Europe |
9.8 |
7.6 |
4.6 |
(3.0) |
(39.5) |
|
Outside Europe |
2.0 |
2.9 |
3.8 |
0.9 |
31.0 |
|
E&P sales |
3.9 |
4.1 |
4.0 |
(0.1) |
(2.2) |
|
Terminals: |
|
|
|
|
|
|
Soyo (Angola) |
|
|
0.1 |
0.1 |
.. |
|
Bontang (Indonesia) |
0.6 |
0.6 |
0.5 |
(0.1) |
(16.7) |
|
Point Fortin (Trinidad & Tobago) |
0.4 |
0.5 |
0.6 |
0.1 |
22.4 |
|
Bonny (Nigeria) |
2.5 |
2.7 |
2.4 |
(0.3) |
(10.1) |
|
Darwin (Australia) |
0.4 |
0.3 |
0.4 |
0.1 |
21.2 |
|
|
15.7 |
14.6 |
12.4 |
(2.2) |
(15.0) |
Power
Availability of electricity
Eni’s power generation sites are located in Ferrera Erbognone, Ravenna, Livorno, Taranto, Mantova, Brindisi, Ferrara and Bolgiano. In 2013, power generation was 23.03 TWh, down 2.64 TWh, or 10.3% from 2012. As of December 31, 2013, installed operational capacity was 5.3 GW (5.3 GW as of December 31, 2012).
Electricity trading, to increase availability of electricity, lowered by 28.9% to 12.2 TWh due to lower purchases on the market.
Power sales
In 2013 power sales (35.05 TWh) were directed to the free market (82%), industrial sites (9%), the Italian power exchange (6%) and others (3%). Compared with 2012, electricity sales were down by 17.7%, due to lower volumes traded on the Italian power exchange and declining sales to wholesales, partly offset by higher sales to retail customers.
|
|
|
2011 |
2012 |
2013 |
Change |
% Ch. |
|
Purchases of natural gas |
(mmcm) |
5,008 |
5,206 |
4,635 |
(571) |
(11.0) |
|
Purchases of other fuels |
(ktoe) |
528 |
462 |
449 |
(13) |
(2.8) |
|
Power generation |
(TWh) |
25.23 |
25.67 |
23.03 |
(2.64) |
(10.3) |
|
Steam |
(ktonnes) |
14,401 |
12,603 |
10,099 |
(2,504) |
(19.9) |
|
Availability of electricity |
(TWh) |
2011 |
2012 |
2013 |
Change |
% Ch. |
||
|
||||||||
|
Power generation |
|
25.23 |
25.67 |
23.03 |
(2.64) |
(10.3) |
||
|
Trading of electricity (a) |
|
15.05 |
16.91 |
12.02 |
(4.89) |
(28.9) |
||
|
|
|
40.28 |
42.58 |
35.05 |
(7.53) |
(17.7) |
||
|
Free market |
|
27.25 |
31.84 |
28.73 |
(3.11) |
(9.8) |
||
|
Italian Exchange for electricity |
|
8.67 |
6.10 |
1.96 |
(4.14) |
(67.9) |
||
|
Industrial plants |
|
3.23 |
3.30 |
3.31 |
0.01 |
0.3 |
||
|
Other (a) |
|
1.13 |
1.34 |
1.05 |
(0.29) |
(21.6) |
||
|
Power sales |
|
40.28 |
42.58 |
35.05 |
(7.53) |
(17.7) |
||
In 2013, as part of its activities selling natural gas and electricity with the aim of improving planning of commercial actions and monitoring technologies for energy efficiency, Eni continued successfully the development of “eni kassandra meteo forecast” (e-km™), a proprietary system for forecasting temperatures from meteorological and climate data in the short/long-term (from 1 to 90 days) over large European areas (including Italy, Belgium, Germany and France). The system will be applied to power generation activity at EniPower plants and on the largest Italian cities.
During the year the company continued the development of the proprietary technology “vibroacustic pipeline monitoring system” (e-vpms™) for the continuing remote control based on theoretical models of elastic-acoustic propagation of pipelines, used for the transportation of natural gas, oil and water in variable operating conditions.