Main data
Key financial data
|
Key financial data (a) |
||||||||||||||
|
(€ million) |
2004 |
2005 |
2006 |
2007 |
2008 |
2009 |
2010 |
2011 |
2012 (b) |
2013 |
||||
|
||||||||||||||
|
|
|
|
|
|
|
|
|
|
|
|
||||
|
Net sales from operations |
57,498 |
73,692 |
86,071 |
87,204 |
108,082 |
83,227 |
98,523 |
109,589 |
128,592 |
114,722 |
||||
|
of which: continuing operations |
|
|
|
|
106,978 |
81,932 |
96,617 |
107,690 |
127,220 |
114,722 |
||||
|
Group operating profit |
12,399 |
16,664 |
19,336 |
18,739 |
18,517 |
12,055 |
16,111 |
17,435 |
15,962 |
8,856 |
||||
|
Special items |
(448) |
(1,210) |
88 |
(620) |
2,034 |
1,295 |
2,290 |
1,567 |
4,795 |
3,046 |
||||
|
Profit (loss) on stock |
631 |
1,942 |
1,059 |
885 |
936 |
(345) |
(881) |
(1,113) |
(17) |
716 |
||||
|
Group adjusted operating profit |
12,582 |
17,396 |
20,483 |
19,004 |
21,487 |
13,005 |
17,520 |
17,889 |
20,740 |
12,618 |
||||
|
Adjusted operating profit – continuing operations |
|
|
|
|
21,322 |
12,722 |
16,845 |
17,230 |
19,798 |
12,618 |
||||
|
Exploration & Production |
8,202 |
12,649 |
15,521 |
13,770 |
17,166 |
9,489 |
13,898 |
16,075 |
18,537 |
14,646 |
||||
|
Gas & Power |
3,448 |
3,783 |
4,117 |
4,414 |
1,778 |
2,022 |
1,268 |
(247) |
356 |
(663) |
||||
|
Refining & Marketing |
923 |
1,210 |
794 |
292 |
555 |
(381) |
(181) |
(539) |
(321) |
(482) |
||||
|
Versalis |
263 |
261 |
219 |
116 |
(382) |
(441) |
(96) |
(273) |
(483) |
(386) |
||||
|
Engineering & Construction |
215 |
314 |
508 |
840 |
1,041 |
1,120 |
1,326 |
1,443 |
1,474 |
(84) |
||||
|
Other activities |
(223) |
(296) |
(299) |
(207) |
(244) |
(258) |
(205) |
(226) |
(222) |
(210) |
||||
|
Corporate and financial companies |
(187) |
(384) |
(244) |
(195) |
(282) |
(342) |
(265) |
(266) |
(325) |
(332) |
||||
|
Impact of unrealized intragroup profit elimination and consolidation adjustments |
(59) |
(141) |
(133) |
(26) |
1,690 |
1,513 |
1,100 |
1,263 |
782 |
129 |
||||
|
Adjusted operating profit – discontinued operations |
|
|
|
|
165 |
283 |
675 |
659 |
942 |
|
||||
|
Group net profit |
7,059 |
8,788 |
9,217 |
10,011 |
8,825 |
4,367 |
6,318 |
6,860 |
7,790 |
5,160 |
||||
|
of which: continuing operations |
|
|
|
|
8,996 |
4,488 |
6,252 |
6,902 |
4,200 |
5,160 |
||||
|
discontinued operations |
|
|
|
|
(171) |
(121) |
66 |
(42) |
3,590 |
|
||||
|
Group adjusted net profit |
6,645 |
9,251 |
10,401 |
9,569 |
10,164 |
5,207 |
6,869 |
6,969 |
7,325 |
4,433 |
||||
|
of which: continuing operations |
|
|
|
|
10,315 |
5,321 |
6,770 |
6,938 |
7,130 |
4,433 |
||||
|
discontinued operations |
|
|
|
|
(151) |
(114) |
99 |
31 |
195 |
|
||||
|
Net cash provided by operating activities |
12,500 |
14,936 |
17,001 |
15,517 |
21,801 |
11,136 |
14,694 |
14,382 |
12,371 |
10,969 |
||||
|
of which: continuing operations |
|
|
|
|
21,506 |
10,755 |
14,140 |
13,763 |
12,356 |
10,969 |
||||
|
discontinued operations |
|
|
|
|
295 |
381 |
554 |
619 |
15 |
|
||||
|
Capital expenditure |
7,499 |
7,414 |
7,833 |
10,593 |
14,562 |
13,695 |
13,870 |
13,438 |
13,517 |
12,750 |
||||
|
of which: continuing operations |
|
|
|
|
12,935 |
12,216 |
12,450 |
11,909 |
12,761 |
12,750 |
||||
|
discontinued operations |
|
|
|
|
1,627 |
1,479 |
1,420 |
1,529 |
756 |
|
||||
|
Shareholders’ equity including non-controlling interests |
35,540 |
39,217 |
41,199 |
42,867 |
48,510 |
50,051 |
55,728 |
60,393 |
62,558 |
61,174 |
||||
|
Net borrowings |
10,443 |
10,475 |
6,767 |
16,327 |
18,376 |
23,055 |
26,119 |
28,032 |
15,511 |
15,428 |
||||
|
Leverage |
0.29 |
0.27 |
0.16 |
0.38 |
0.38 |
0.46 |
0.47 |
0.46 |
0.25 |
0.25 |
||||
|
Net capital employed |
45,983 |
49,692 |
47,966 |
59,194 |
66,886 |
73,106 |
81,847 |
88,425 |
78,069 |
76,602 |
||||
|
Exploration & Production |
16,770 |
19,109 |
17,783 |
23,826 |
31,362 |
32,455 |
37,646 |
42,024 |
42,394 |
45,721 |
||||
|
Gas & Power |
19,554 |
20,075 |
19,713 |
21,333 |
9,636 |
11,024 |
12,931 |
12,367 |
11,124 |
9,735 |
||||
|
Snam |
|
|
|
|
11,918 |
13,730 |
14,415 |
15,393 |
|
|
||||
|
Refining & Marketing |
5,081 |
5,993 |
5,631 |
7,675 |
7,379 |
8,105 |
8,321 |
9,188 |
8,846 |
7,969 |
||||
|
Versalis |
2,076 |
2,018 |
1,953 |
2,228 |
1,915 |
1,774 |
1,978 |
2,252 |
2,557 |
2,656 |
||||
|
Engineering & Construction |
2,403 |
2,844 |
3,399 |
4,313 |
5,022 |
6,566 |
7,610 |
8,217 |
9,992 |
9,616 |
||||
|
Corporate financial companies and other activities |
277 |
2 |
(95) |
294 |
24 |
(192) |
(527) |
(393) |
3,659 |
1,382 |
||||
|
Impact of unrealized intragroup profit elimination |
(178) |
(349) |
(418) |
(475) |
(370) |
(356) |
(527) |
(623) |
(503) |
(477) |
||||
Key market indicators
|
Key market indicators |
|
2004 |
2005 |
2006 |
2007 |
2008 |
2009 |
2010 |
2011 |
2012 |
2013 |
||||||
|
|||||||||||||||||
|
|
|
|
|
|
|
|
|
|
|
|
|
||||||
|
Average price of Brent dated crude oil (a) |
|
38.22 |
54.38 |
65.14 |
72.52 |
96.99 |
61.51 |
79.47 |
111.27 |
111.58 |
108.66 |
||||||
|
Average EUR/USD exchange rate (b) |
|
1.244 |
1.244 |
1.256 |
1.371 |
1.471 |
1.393 |
1.327 |
1.392 |
1.285 |
1.328 |
||||||
|
Average price in euro of Brent dated crude oil |
|
30.72 |
43.71 |
51.86 |
52.90 |
65.93 |
44.16 |
59.89 |
79.94 |
86.83 |
81.82 |
||||||
|
Average European refining margin (c) |
|
4.35 |
5.78 |
3.79 |
4.52 |
6.49 |
3.13 |
2.66 |
2.06 |
4.83 |
2.64 |
||||||
|
Average European refining margin Brent/Ural (c) |
|
7.03 |
8.33 |
6.50 |
6.45 |
8.85 |
3.56 |
3.47 |
2.90 |
4.94 |
2.60 |
||||||
|
Euribor - three-month euro rate |
(%) |
2.1 |
2.2 |
3.1 |
4.3 |
4.6 |
1.2 |
0.8 |
1.4 |
0.6 |
0.2 |
||||||
Selected operating data
|
Selected operating data |
2004 |
2005 |
2006 |
2007 |
2008 |
2009 |
2010 |
2011 |
2012 |
2013 |
|||||
|
|||||||||||||||
|
Corporate (a) |
|
|
|
|
|
|
|
|
|
|
|
||||
|
Employees at period end |
(number) |
71,572 |
71,773 |
72,850 |
75,125 |
71,714 |
71,461 |
73,768 |
72,574 |
77,838 |
82,289 |
||||
|
of which: - women |
|
10,326 |
10,620 |
10,841 |
10,977 |
11,611 |
11,955 |
12,161 |
12,542 |
12,860 |
13,601 |
||||
|
- outside Italy |
|
32,691 |
34,036 |
35,818 |
38,634 |
41,971 |
42,633 |
45,967 |
45,516 |
51,034 |
55,507 |
||||
|
Female managers |
(%) |
12.5 |
12.4 |
13.5 |
14.1 |
16.3 |
17.3 |
18.0 |
18.5 |
18.9 |
19.4 |
||||
|
Employees injury frequency rate |
(number of accidents per million of worked hours) |
3.99 |
2.74 |
2.45 |
1.93 |
1.22 |
0.84 |
0.80 |
0.65 |
0.57 |
0.40 |
||||
|
Contractors injury frequency rate |
|
7.84 |
2.59 |
1.54 |
1.45 |
1.09 |
0.97 |
0.71 |
0.57 |
0.45 |
0.32 |
||||
|
Fatality index |
(fatal injuries per one hundred millions of worked hours) |
5.64 |
3.38 |
2.31 |
2.97 |
2.75 |
1.20 |
4.77 |
1.94 |
1.10 |
0.98 |
||||
|
Oil spills due to operations |
(barrels) |
7,813 |
6,908 |
6,151 |
6,731 |
4,749 |
6,259 |
4,269 |
7,295 |
3,759 |
1,901 |
||||
|
Direct GHG emission |
(mmtonnes CO2eq) |
58.34 |
61.85 |
60.72 |
67.25 |
59.59 |
55.49 |
58.26 |
49.13 |
52.50 |
47.30 |
||||
|
R&D expenditure (b) |
(€ million) |
257 |
204 |
222 |
208 |
211 |
233 |
218 |
190 |
211 |
197 |
||||
|
Exploration & Production |
|
|
|
|
|
|
|
|
|
|
|||||
|
Proved reserves of hydrocarbons |
(mmboe) |
7,218 |
6,837 |
6,436 |
6,370 |
6,600 |
6,571 |
6,843 |
7,086 |
7,166 |
6,535 |
||||
|
Reserve life index |
(years) |
12.1 |
10.8 |
10.0 |
10.0 |
10.0 |
10.2 |
10.3 |
12.3 |
11.5 |
11.1 |
||||
|
Production of hydrocarbons |
(kboe/d) |
1,624 |
1,737 |
1,770 |
1,736 |
1,797 |
1,769 |
1,815 |
1,581 |
1,701 |
1,619 |
||||
|
Gas & Power |
|
|
|
|
|
|
|
|
|
|
|
||||
|
Sales of consolidated companies (including own consumption) |
(bcm) |
76.49 |
82.62 |
85.76 |
84.83 |
89.32 |
89.60 |
82.00 |
84.05 |
84.30 |
83.60 |
||||
|
Sales of Eni’s affiliates (Eni’s share) |
|
5.84 |
7.08 |
7.65 |
8.74 |
8.91 |
7.95 |
9.41 |
9.85 |
8.29 |
6.96 |
||||
|
Total sales and own consumption (G&P) |
|
82.33 |
89.70 |
93.41 |
93.57 |
98.23 |
97.55 |
91.41 |
93.90 |
92.59 |
90.56 |
||||
|
E&P sales in Europe and in the Gulf of Mexico |
|
4.70 |
4.51 |
4.69 |
5.39 |
6.00 |
6.17 |
5.65 |
2.86 |
2.73 |
2.61 |
||||
|
Worldwide gas sales |
|
87.03 |
94.21 |
98.10 |
98.96 |
104.23 |
103.72 |
97.06 |
96.76 |
95.32 |
93.17 |
||||
|
Electricity sold |
(TWh) |
16.95 |
27.56 |
31.03 |
33.19 |
29.93 |
33.96 |
39,54 |
40.28 |
42.58 |
35.05 |
||||
|
Refining & Marketing |
|
|
|
|
|
|
|
|
|
|
|||||
|
Throughputs on own account |
(mmtonnes) |
37.69 |
38.79 |
38.04 |
37.15 |
35.84 |
34.55 |
34,80 |
31.96 |
30.01 |
27.38 |
||||
|
Balanced capacity of wholly-owned refineries |
(kbbl/d) |
504 |
524 |
534 |
544 |
737 |
747 |
757 |
767 |
767 |
787 |
||||
|
Sales of refined products |
(mmtonnes) |
53.54 |
51.63 |
51.13 |
50.15 |
49.16 |
45.59 |
46.80 |
45.02 |
48.33 |
43.49 |
||||
|
Retail sales in Europe |
|
14.40 |
12.42 |
12.48 |
12.65 |
12.03 |
12.02 |
11,73 |
11.37 |
10.87 |
9.69 |
||||
|
Service stations at year end |
(units) |
9,140 |
6,282 |
6,294 |
6,440 |
5,956 |
5,986 |
6,167 |
6,287 |
6,384 |
6,386 |
||||
|
Average throughput per service station |
(kliters/y) |
1,970 |
2,479 |
2,470 |
2,486 |
2,502 |
2,477 |
2,353 |
2,206 |
2,064 |
1,828 |
||||
|
Versalis |
|
|
|
|
|
|
|
|
|
|
|
||||
|
Production |
(ktonnes) |
7,118 |
7,282 |
7,072 |
8,795 |
7,372 |
6,521 |
7,220 |
6,245 |
6,090 |
5,817 |
||||
|
of which: - Intermediates |
4,236 |
4,450 |
4,275 |
5,688 |
5,110 |
4,350 |
4,860 |
4,101 |
3,595 |
3,462 |
|||||
|
- Polymers |
|
2,882 |
2,832 |
2,797 |
3,107 |
2,262 |
2,171 |
2,360 |
2,144 |
2,495 |
2,355 |
||||
|
Average plant utilization rate |
(%) |
75.2 |
78.4 |
76.4 |
80.6 |
68.6 |
65.4 |
72.9 |
65.3 |
66.7 |
65.3 |
||||
|
Engineering & Construction |
|
|
|
|
|
|
|
|
|
|
|||||
|
Orders acquired |
(€ million) |
5,784 |
8,395 |
11,172 |
11,845 |
13,860 |
9,917 |
12,935 |
12,505 |
13,391 |
10,653 |
||||
|
Order backlog at year end |
8,521 |
10,122 |
13,191 |
15,390 |
19,105 |
18,370 |
20,505 |
20,417 |
19,739 |
17,514 |
|||||
Share data
|
Share data |
|
2004 |
2005 |
2006 |
2007 |
2008 |
2009 |
2010 |
2011 |
2012 |
2013 |
||||||||||||
|
|||||||||||||||||||||||
|
Net profit (a) (b) |
(€) |
1.87 |
2.34 |
2.49 |
2.73 |
2.43 |
1.21 |
1.74 |
1.89 |
2.15 |
1.42 |
||||||||||||
|
Net profit - continuing operations (a) (b) (*) |
|
|
|
|
|
2.47 |
1.24 |
1.72 |
1.90 |
1.16 |
1.42 |
||||||||||||
|
Dividend |
(€ million) |
0.90 |
1.10 |
1.25 |
1.30 |
1.30 |
1.00 |
1.00 |
1.04 |
1.08 |
1.10 |
||||||||||||
|
Dividend pertaining to the year |
|
3,384 |
4,086 |
4,594 |
4,750 |
4,714 |
3,622 |
3,622 |
3,695 |
3,840 |
3,949 |
||||||||||||
|
Cash flow |
(€) |
3.31 |
3.97 |
4.59 |
4.23 |
5.99 |
3.07 |
4.06 |
3.97 |
3.41 |
3.52 |
||||||||||||
|
Dividend yield (c) |
(%) |
4.9 |
4.7 |
5.0 |
5.3 |
7.6 |
5.8 |
6.1 |
6.6 |
5.9 |
6.5 |
||||||||||||
|
Net profit per ADR (d) (*) |
(US$) |
4.66 |
5.81 |
6.26 |
7.49 |
7.27 |
3.45 |
4.59 |
5.29 |
2.98 |
3.77 |
||||||||||||
|
Dividend per ADR (d) |
|
2.17 |
2.74 |
3.14 |
3.56 |
3.82 |
2.79 |
2.65 |
2.90 |
2.78 |
2.83 |
||||||||||||
|
Cash flow per ADR (d) |
|
8.96 |
9.40 |
11.53 |
11.60 |
17.63 |
8.56 |
10.77 |
11.05 |
8.77 |
9.04 |
||||||||||||
|
Dividend yield per ADR (c) |
(%) |
5.0 |
4.7 |
5.0 |
5.3 |
7.6 |
5.8 |
6.1 |
6.6 |
5.8 |
4.6 |
||||||||||||
|
Pay-out |
|
48 |
46 |
50 |
47 |
53 |
81 |
57 |
55 |
50 |
77 |
||||||||||||
|
Number of shares at period-end representing share capital |
(million shares) |
4,004.4 |
4,005.4 |
4,005.4 |
4,005.4 |
4,005.4 |
4,005.4 |
4,005.4 |
4,005.4 |
3,634.2 |
3,634.2 |
||||||||||||
|
Average number of shares outstanding in the year (e) (fully diluted) |
|
3,771.7 |
3,763.4 |
3,701.3 |
3,669.2 |
3,638.9 |
3,622.4 |
3,622.5 |
3,622.7 |
3,622.8 |
3,622.8 |
||||||||||||
|
TSR |
(%) |
28.5 |
35.3 |
14.8 |
3.2 |
(29.1) |
13.7 |
(2.2) |
5.1 |
22.0 |
1.3 |
||||||||||||
|
Share information |
2004 |
2005 |
2006 |
2007 |
2008 |
2009 |
2010 |
2011 |
2012 |
2013 |
|||||||
|
|||||||||||||||||
|
|
|
|
|
|
|
|
|
|
|
|
|
||||||
|
Share price - Milan Stock Exchange |
|
|
|
|
|
|
|
|
|
|
|||||||
|
High |
(€) |
18.75 |
24.96 |
25.73 |
28.33 |
26.93 |
18.35 |
18.56 |
18.42 |
18.70 |
19.48 |
||||||
|
Low |
|
14.72 |
17.93 |
21.82 |
22.76 |
13.80 |
12.30 |
14.61 |
12.17 |
15.25 |
15.29 |
||||||
|
Average |
|
16.94 |
21.60 |
23.83 |
25.10 |
21.43 |
16.59 |
16.39 |
15.95 |
17.18 |
17.57 |
||||||
|
End of the period |
|
18.42 |
23.43 |
25.48 |
25.05 |
16.74 |
17.80 |
16.34 |
16.01 |
18.34 |
17.49 |
||||||
|
ADR price (a) - New York Stock Exchange |
|
|
|
|
|
|
|
|
|
||||||||
|
High |
(US$) |
126.45 |
151.35 |
67.69 |
78.29 |
84.14 |
54.45 |
53.89 |
53.74 |
49.44 |
52.12 |
||||||
|
Low |
|
92.35 |
118.50 |
54.65 |
60.22 |
37.22 |
31.07 |
35.37 |
32.98 |
36.85 |
40.39 |
||||||
|
Average |
|
105.60 |
134.02 |
59.97 |
68.80 |
63.38 |
46.36 |
43.56 |
44.41 |
44.24 |
46.68 |
||||||
|
End of the period |
|
125.84 |
139.46 |
67.28 |
72.43 |
47.82 |
50.61 |
43.74 |
41.27 |
49.14 |
48.49 |
||||||
|
Average daily exchanged shares |
(million shares) |
20.0 |
28.5 |
26.2 |
30.5 |
28.7 |
27.9 |
20.7 |
22.9 |
15.6 |
15.4 |
||||||
|
Value |
(€ million) |
338.7 |
620.7 |
619.1 |
773.1 |
610.4 |
461.7 |
336.0 |
355.0 |
267.0 |
271.4 |
||||||
|
Number of shares outstanding at period end (b) |
(million shares) |
3,770.0 |
3,727.3 |
3,680.4 |
3,656.8 |
3,622.4 |
3,622.4 |
3,622.7 |
3,622.7 |
3,622.8 |
3,622.8 |
||||||
|
Market capitalization (c) |
|
|
|
|
|
|
|
|
|
|
|
||||||
|
EUR |
(billion) |
69.4 |
87.3 |
93.8 |
91.6 |
60.6 |
64.5 |
59.2 |
58.0 |
66.4 |
63.4 |
||||||
|
USD |
|
94.9 |
104.0 |
123.8 |
132.4 |
86.6 |
91.7 |
79.2 |
75.0 |
87.7 |
87.4 |
||||||
|
Data on Eni share placement |
1995 |
1996 |
1997 |
1998 |
2001 |
|||
|
||||||||
|
|
|
|
|
|
|
|
||
|
Offer price |
(€/share) |
5.42 |
7.40 |
9.90 |
11.80 |
13.60 |
||
|
Number of share placed |
(million shares) |
601.9 |
647.5 |
728.4 |
608.1 |
200.1 |
||
|
of which: through bonus share |
|
|
1.9 |
15.0 |
24.4 |
39.6 |
||
|
Percentage of share capital (a) |
(%) |
15.0 |
16.2 |
18.2 |
15.2 |
5.0 |
||
|
Proceeds |
(€ million) |
3.254 |
4,596 |
6,869 |
6,714 |
2,721 |
||
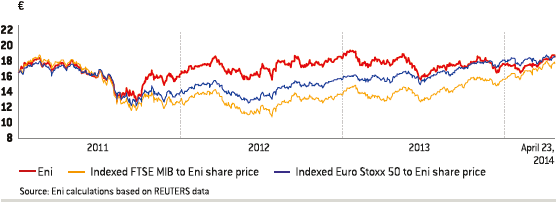
Eni share price in Milan - (December 31, 2010 - April 23, 2014)
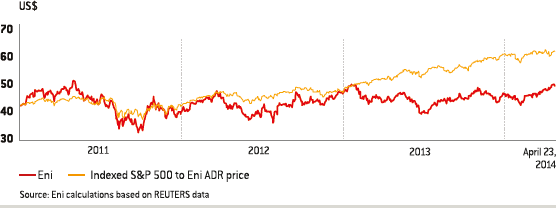
Eni ADR price in New York - (December 31, 2010 - April 23, 2014)
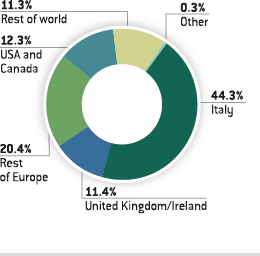
Shareholders distribution by geographic area(*)
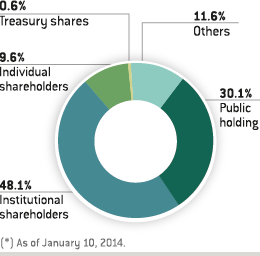
Class of shareholders(*)