Profile of the year
Results
Solid results and cash flow
+23% vs. 2012
net profit
€10.97 bln
cash flow
In 2013 Eni achieved solid results in a particularly difficult market. In spite of geopolitical factors in Libya, Nigeria and Algeria, the Exploration & Production Division delivered robust earnings and cash flow leveraging its cost leadership and extraordinary exploration successes. The mid-downstream businesses, which were impacted by the downturn and plunging demand in Europe and Italy, boosted their restructuring efforts achieving an impressive €2 billion improvement in cash generation. Finally, the portfolio management enhanced by the new discoveries of the latest years enabled Eni to anticipate the monetization of results and cash. The overall effect of management’s actions in such a challenging year was to deliver a 23% increase in net profit versus to €5.16 billion, to pay a generous dividend and to launch a buyback program, while maintaining a constant debt at €15.43 billion.
Turnaround in mid-downstream
+€2 bln
cash flow improvement
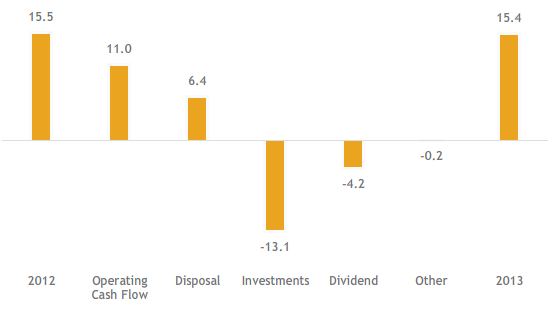
Net cash generated by operating activities of €10.97 billion and cash from disposals of €6.36 billion, mainly related to the Mozambique deal, were used to fund capital expenditure of €12.75 billion and dividend payments of €3.95 billion to Eni’s shareholders.
Ratio of net borrowings to shareholders’ equity including minority interest – leverage – was 0.25 at December 31, 2013, unchanged compared to December 31, 2012.
Dividend
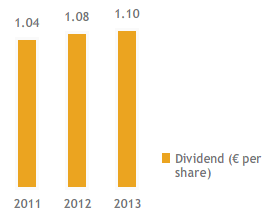
The Company’s robust results and strong fundamentals underpin a dividend distribution of €1.10 per share (€1.08 in 2012). Management reaffirms its commitment to deliver a progressive dividend policy taking into account Eni’s underlying growth in earnings and cash flow.
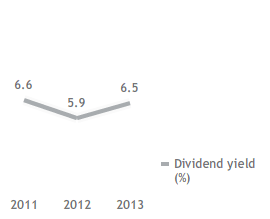
Dividend and dividend yield
Hydrocarbon production
In 2013, hydrocarbon production declined to 1.619 million boe/d by 4.8% from 2012, reflecting significant force majeure events in Libya, Nigeria and Algeria, partly offset by the contribution of the start-up of new fields and continuing production ramp-ups.
Proved oil and natural gas reserves
Proved reserves
6.54 bboe
at year end
Proved oil and gas reserves as of December 31, 2013 were 6.54 bboe. The organic reserve replacement ratio was 105%. The reserve life index is 11.1 years.
Natural gas supply contracts
Renegotiated purchase terms of 85% of the Company’s long-term gas supply contracts, resulting in a €1.4 billion cost saving.
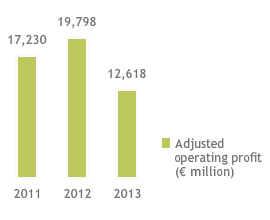
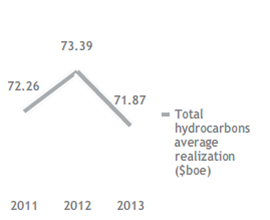
Operating performance
Natural gas sales
Natural gas sales declined by 2.3% to 93.17 bcm against the backdrop of an ongoing demand downturn, competitive pressure and oversupply.
Net borrowings and leverage
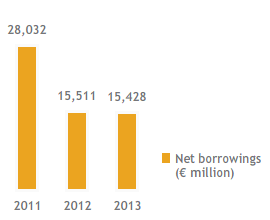
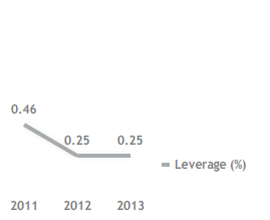
Divestment of Eni’s interest in Eni East Africa
In July 2013, Eni closed the sale of a 28.57% interest in Eni East Africa (EEA) to China National Petroleum Corporation (CNPC). CNPC indirectly acquires, through its equity investment in Eni East Africa, a 20% interest in the Area 4 mineral property, located offshore of Mozambique. Eni retains operatorship and a 50% interest through the remaining stake in the investee. The total consideration cashed-in by Eni was €3,386 million, with a gain of equivalent amount recorded in profit and loss (€3,359 million, €2,994 million net of tax charges).
Oil and gas reserves
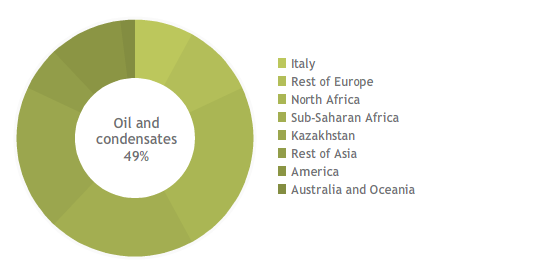
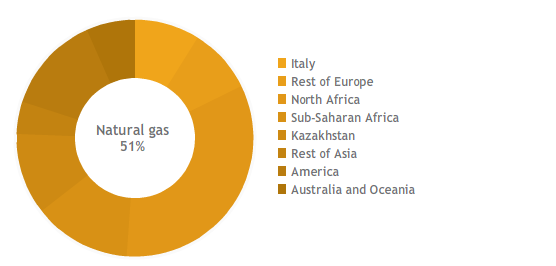
Divestment of Eni’s interest in Artic Russia
In January 2014 Eni closed the sale of its 60% stake in Artic Russia to certain Gazprom affiliates for a total sale price of €2.2 billion. At the balance sheet date, Eni’s interest in Artic Russia was stated at fair value due to the loss of joint control over the investee with a revaluation gain of €1,682 million recorded through profit.
While with the disposal Eni monetized a mature investment, the Company still maintains a strong commitment in the Russian upstream.
2013 net borrowings evolution (€ billion)
Safety
Injury frequency rate
-28.7%
progressing for the ninth consecutive year
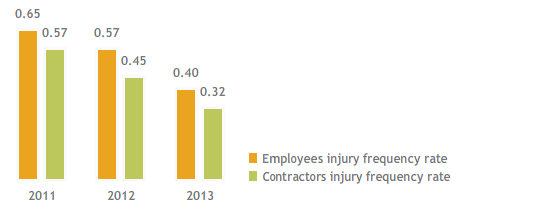
In 2013 Eni continued to implement the communication and training program “Eni in safety”, with 185 workshops dedicated to Eni’s employees. The benefit of these and other programmes in safety is confirmed by the positive trend of the injury frequency rate relating to employees and contractors which improved for the ninth consecutive year (down by 28.7% from 2012). Notwithstanding the 10.5% decrease in the fatality index, six fatal accidents occurred in 2013.
Partnership for Sustainable Energy
Among the “UN Sustainable Development Solutions Network (SDSN)”, in 2013 Eni led the Energy For All in Sub-Saharan Africa initiative through international collaborations aimed at devising solutions to fight against energy poverty, in particular in Sub-Saharan Africa. For this purpose, Eni wil leverage on the strategic partnership signed with the Earth Institute of the Columbia University.
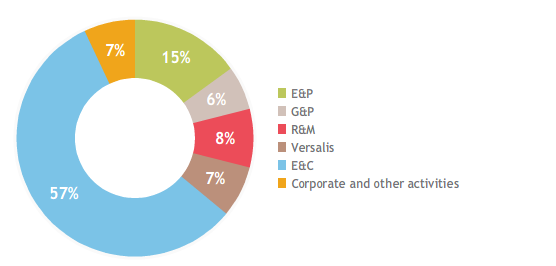
2013 employees by segment
Relationships with the territory and local development
In 2013 Eni’s commitment continued in ensuring access of local communities to energy, particularly in Sub-Saharan Africa. In Mozambique Eni announced the construction of a gas fired plant with a capacity of 75 MW, in the Cabo Delgado area. In Italy, the Company signed a MoU with the city of L’Aquila for the restoration of the Basilica of Santa Maria Collemaggio and the redevelopment of the Parco del Sole.
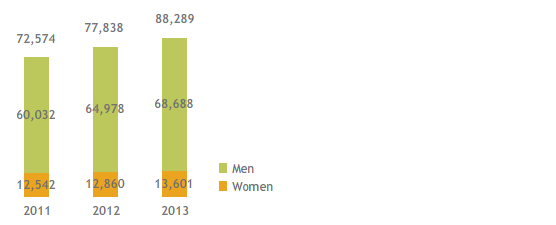
Employees at period end (number)
Exploration successes
Exploration successes
1.8 bln boe
at year end
The exploration activity for the year delivered strong results adding 1.8 billion boe of resources to the company’s resource base, with a unit exploration cost of 1.2 $/boe.
In Mozambique, the exploration campaign assessed the potential of the Mamba and Coral discoveries, while the Agulha discovery revealed a new gas accumulation in the Southern section of Area 4. Agulha was the tenth discovery made in Area 4. Management estimates that Area 4 may contain up to 2,650 billion cubic meters of gas in place.
In Congo, an exciting discovery was made in the mature Block Marine XII offshore. The Nené Marine oil and gas discovery and the adjacent Litchendjili Marine field found an overall potential of about 2.5 billion boe in place.
In Australia, the Evans Shoal North-1 discovery, in the Timor Sea, was estimated to contain a mineral potential of 8 tcf of gas in place.
Acquired acreage
In the year Eni rejuvenated its mineral right portfolio entering new high potential areas for a total acreage of approximately 120,000 square kilometers.
Injury frequency rate (No. of accidents per million of worked hours)
Start-ups
In line with production plans, in 2013 eight major projects have been started up, contributing for 140,000 boe/d to the year production. The main start-ups related to: MLE-CAFC (Eni’s interest 75%) and El Merk (Eni’s interest 12.25%) fields in Algeria, the liquefaction plant Angola LNG (Eni’s interest 13.6%), the offshore Abo-Phase 3 project in Nigeria, the giant heavy oil field Junin 5 (Eni’s interest 40%) in Venezuela, the Skuld field (Eni’s interest 11.5%) in Norway, the Kashagan field (Eni’s interest 16.81%) in Kazakhstan and the Jasmine project (Eni’s interest 33%) in the United Kingdom.
Versalis
In 2013, Eni’s chemical subsidiary Versalis progressed with the expansion in the bio-plastic segment and the diversification of the commodity chemical, by entering into joint ventures with strategic international partners active in bio-technologies and rubber, among which Pirelli, Genomatica, Yulex Corporation and Lotte Chemical.
In the green chemistry business Versalis carried on the ongoing project of converting the Porto Torres site and a relevant agreement has been reached to start the project for the conversion and relaunching of the Porto Marghera site.
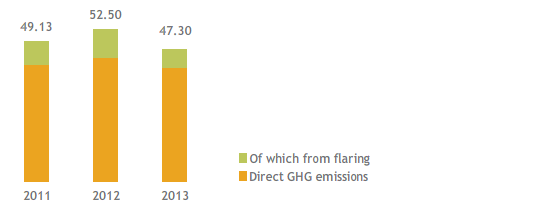
Direct GHG emissions (mmtonnes CO2eq)
Green Data Center
In October 2013 Eni launched the Green Data Center, the best in the world for energy efficiency. It hosts Eni’s central computer processing systems, both for information management and seismic simulation processing, allowing a reduction of CO2 emissions by 300,000 tons per year.
Transparency in Corporate Reporting
In 2013 Eni has been ranked first in a survey conducted by Transparency International Italy into the corporate reporting on transparency. The survey, which used a sample of the largest Italian companies by market capitalization, has analyzed three areas of transparency in corporate reporting: anti-bribery programs, the organization and the publication of key economic and financial data related to the activities in each Country where the companies operate.
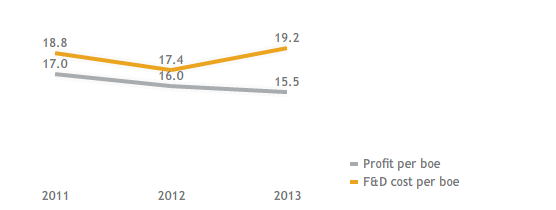
Profit and F&D cost per boe ($/boe)
Eni’s commitment with the Massachusetts Institute of Technology
In February 2013, Eni renewed its commitment to the MIT Energy Initiative (MITEI) to develop innovative, powerful tools, technologies and solutions to address global energy needs and challenges.
|
Financial highlights (*) |
||||||||||||
|
|
|
|
|
|
||||||||
|
|
|
2011 |
2012 |
2013 |
||||||||
|
||||||||||||
|
Net sales from operations |
(€ million) |
107,690 |
127,220 |
114,722 |
||||||||
|
Operating profit |
|
16,803 |
15,071 |
8,856 |
||||||||
|
Adjusted operating profit |
|
17,230 |
19,798 |
12,618 |
||||||||
|
Net profit (a) |
|
6,902 |
4,200 |
5,160 |
||||||||
|
Net profit - discontinued operations (a) |
|
(42) |
3,590 |
|
||||||||
|
Group net profit (a) |
|
6,860 |
7,790 |
5,160 |
||||||||
|
Adjusted net profit (a) |
|
6,938 |
7,130 |
4,433 |
||||||||
|
Net cash provided by operating activities |
|
13,763 |
12,356 |
10,969 |
||||||||
|
Capital expenditure |
|
11,909 |
12,761 |
12,750 |
||||||||
|
Dividends to Eni shareholders pertaining to the period (b) |
|
3,768 |
3,912 |
3,986 |
||||||||
|
Cash dividends to Eni shareholders |
|
3,695 |
3,840 |
3,949 |
||||||||
|
Total assets at period end |
|
142,945 |
139,878 |
138,088 |
||||||||
|
Shareholders’ equity including non-controlling interest at period end |
|
60,393 |
62,558 |
61,174 |
||||||||
|
Net borrowings at period end |
|
28,032 |
15,511 |
15,428 |
||||||||
|
Net capital employed at period end |
|
88,425 |
78,069 |
76,602 |
||||||||
|
Share price at period end |
(€) |
16.01 |
18.34 |
17.49 |
||||||||
|
Number of shares outstanding at period end |
(million) |
3,622.7 |
3,622.8 |
3,622.8 |
||||||||
|
Market capitalization (c) |
(€ billion) |
58.0 |
66.4 |
63.4 |
||||||||
|
Summary financial data |
||||||||||||
|
|
|
|
|
|
||||||||
|
|
|
2011 |
2012 |
2013 |
||||||||
|
||||||||||||
|
Net profit (*) |
|
|
|
|
||||||||
|
- per share (a) |
(€) |
1.90 |
1.16 |
1.42 |
||||||||
|
- per ADR (a) (b) |
($) |
5.29 |
2.98 |
3.77 |
||||||||
|
Adjusted net profit (*) |
|
|
|
|
||||||||
|
- per share (a) |
(€) |
1.92 |
1.97 |
1.22 |
||||||||
|
- per ADR (a) (b) |
($) |
5.35 |
5.06 |
3.24 |
||||||||
|
Adjusted return on average capital employed (ROACE) (c) |
(%) |
10.2 |
10.1 |
5.9 |
||||||||
|
Leverage |
|
0.46 |
0.25 |
0.25 |
||||||||
|
Coverage |
|
15.4 |
11.9 |
8.9 |
||||||||
|
Current ratio |
|
1.1 |
1.4 |
1.5 |
||||||||
|
Debt coverage |
|
51.3 |
79.8 |
71.1 |
||||||||
|
Dividends pertaining to the year |
(€ per share) |
1.04 |
1.08 |
1.10 |
||||||||
|
Pay-out |
(%) |
55 |
50 |
77 |
||||||||
|
Dividend yield (d) |
(%) |
6.6 |
5.9 |
6.5 |
||||||||
|
Operating and sustainability data |
||||||||||||||
|
|
|
|
|
|
||||||||||
|
|
|
2011 |
2012 |
2013 |
||||||||||
|
||||||||||||||
|
Employees at period end |
(number) |
72,574 |
77,838 |
82,289 |
||||||||||
|
of which - women |
|
12,542 |
12,860 |
13,601 |
||||||||||
|
- outside Italy |
|
45,516 |
51,034 |
55,507 |
||||||||||
|
Female managers |
(%) |
18.5 |
18.9 |
19.4 |
||||||||||
|
Training hours |
(thousand hours) |
3,127 |
3,132 |
4,350 |
||||||||||
|
Employees injury frequency rate |
(No. of accidents per million of worked hours) |
0.65 |
0.57 |
0.40 |
||||||||||
|
Contractors injury frequency rate |
|
0.57 |
0.45 |
0.32 |
||||||||||
|
Fatality index |
(fatal injuries per one hundred millions of worked hours) |
1.94 |
1.10 |
0.98 |
||||||||||
|
Oil spills due to operations |
(barrels) |
7,295 |
3,759 |
1,901 |
||||||||||
|
Direct GHG emissions |
(mmtonnes CO2 eq) |
49.13 |
52.50 |
47.30 |
||||||||||
|
R&D expenditure (a) |
(€ million) |
190 |
211 |
197 |
||||||||||
|
Expenditure for the territory (b) |
|
101 |
91 |
101 |
||||||||||
|
Exploration & Production |
|
|
|
|||||||||||
|
Estimated net proved reserves of hydrocarbons (at year end) |
(kboe/d) |
7,086 |
7,166 |
6,535 |
||||||||||
|
Average reserve life index |
(year) |
12.3 |
11.5 |
11.1 |
||||||||||
|
Production of hydrocarbons |
(kboe/d) |
1,581 |
1,701 |
1,619 |
||||||||||
|
Profit per boe (c) |
($/boe) |
17.0 |
16.0 |
15.5 |
||||||||||
|
Opex per boe (c) |
|
7.3 |
7.1 |
8.3 |
||||||||||
|
Cash flow per boe |
|
31.7 |
32.8 |
31.9 |
||||||||||
|
Finding & Development cost per boe (d) |
|
18.8 |
17.4 |
19.2 |
||||||||||
|
Gas & Power |
|
|
|
|||||||||||
|
Worldwide gas sales (e) |
(bcm) |
96.76 |
95.32 |
93.17 |
||||||||||
|
- in Italy |
|
34.68 |
34.78 |
35.86 |
||||||||||
|
- outside Italy |
|
62.08 |
60.54 |
57.31 |
||||||||||
|
Customers in Italy |
(million) |
7.10 |
7.45 |
8.00 |
||||||||||
|
Electricity sold |
(TWh) |
40.28 |
42.58 |
35.05 |
||||||||||
|
Customer satisfaction index |
(%) |
88.6 |
89.7 |
90.4 |
||||||||||
|
Refining & Marketing |
|
|
|
|||||||||||
|
Refinery throughputs on own account |
(mmtonnes) |
31.96 |
30.01 |
27.38 |
||||||||||
|
Retail market share |
(%) |
30.5 |
31.2 |
27.5 |
||||||||||
|
Retail sales of petroleum products in Europe |
(mmtonnes) |
11.37 |
10.87 |
9.69 |
||||||||||
|
Service stations in Europe at year end |
(units) |
6,287 |
6,384 |
6,386 |
||||||||||
|
Average throughput of service stations in Europe |
(kliters) |
2,206 |
2,064 |
1,828 |
||||||||||
|
Chemicals |
|
|
|
|||||||||||
|
Production |
(ktonnes) |
6,245 |
6,090 |
5,817 |
||||||||||
|
Sales of petrochemical products |
|
4,040 |
3,953 |
3,785 |
||||||||||
|
Average plant utilization rate |
(%) |
65.3 |
66.7 |
65.3 |
||||||||||
|
Engineering & Construction |
|
|
|
|||||||||||
|
Orders acquired |
(€ million) |
12,505 |
13,391 |
10,653 |
||||||||||
|
Order backlog at period end |
|
20,417 |
19,739 |
17,514 |
||||||||||
